
Water Quality walkthrough
A Day in Water Quality
Explore customizable sign-in, dashboard charts and review queues, then follow sampling work through results, investigation, and reporting.
Download PDF walkthroughFull narration and screenshots, with a link back to this video.
Find what matters to you
Explore the walkthrough
Choose a chapter to play from that point, or read the full narration below.
Read the walkthrough
Narration and screenshots
The complete narration is below. Search the script or use your browser’s Find command. Select any screenshot to view it at full size.
Introduction
Link to chapterIn this video, explore how Adapt FCS connects Water Quality work. We will begin with customizable sign-in, tour dashboard charts and review queues, follow a sample through its results and investigation, and finish with reporting.
Start with access designed for your team
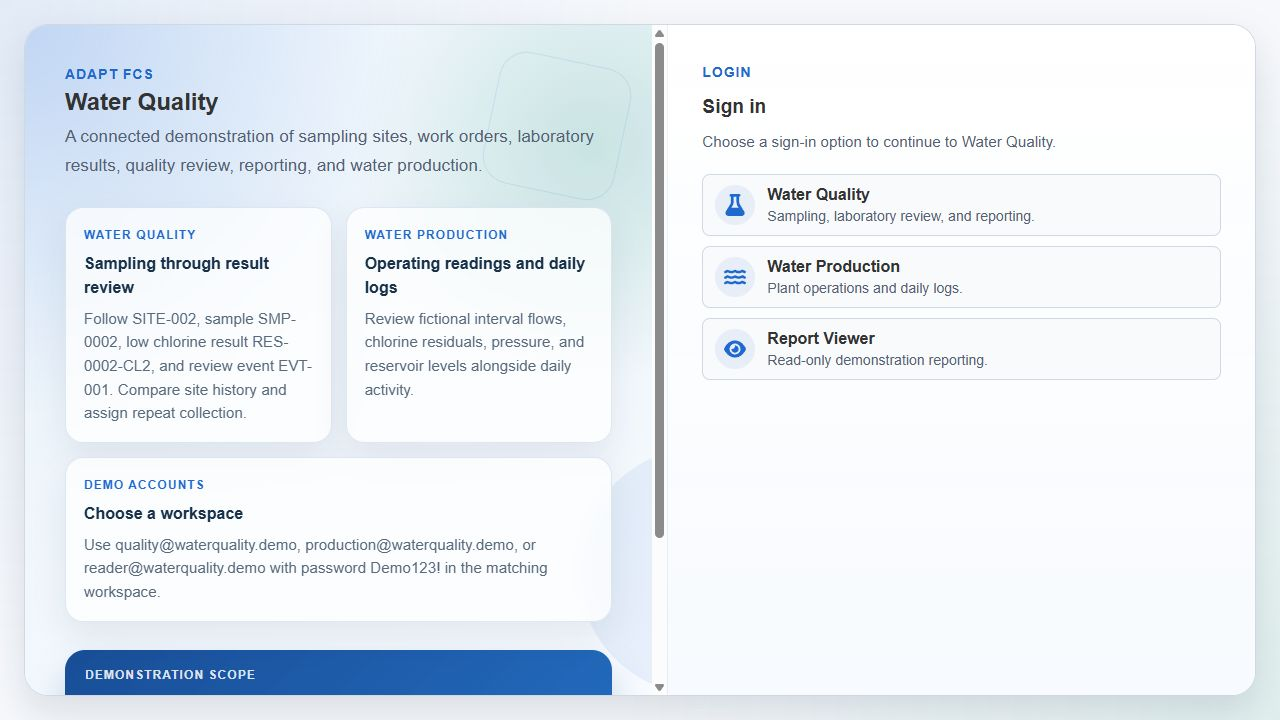
Link to chapterWelcome to a day in Water Quality with Adapt FCS. We begin at the login page. These three options showcase how the system can be customized. Here, Water Quality, Water Production, and Report Viewer provide different workspaces, all using local accounts. For your water utility, internal staff could use your organization's sign-in, while outside contractors use a separate configured method. Alternatively, everyone can use one sign-in option, with profiles and security groups controlling access. Each person still uses their own account. Selecting a button does not grant permission; authorization controls what that user can see and change. We would configure and verify organization sign-in with your IT team. After signing in to Water Quality, we reach the dashboard. All demonstration records are fictional.
Start with the morning overview
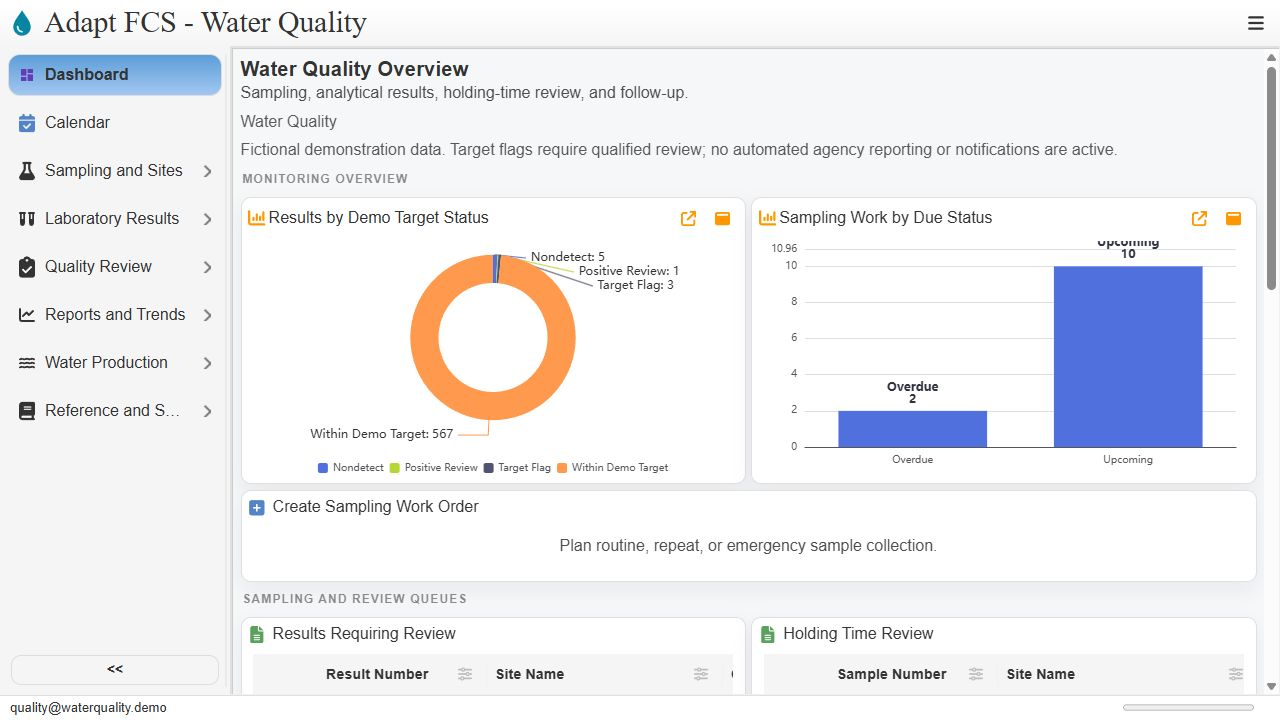
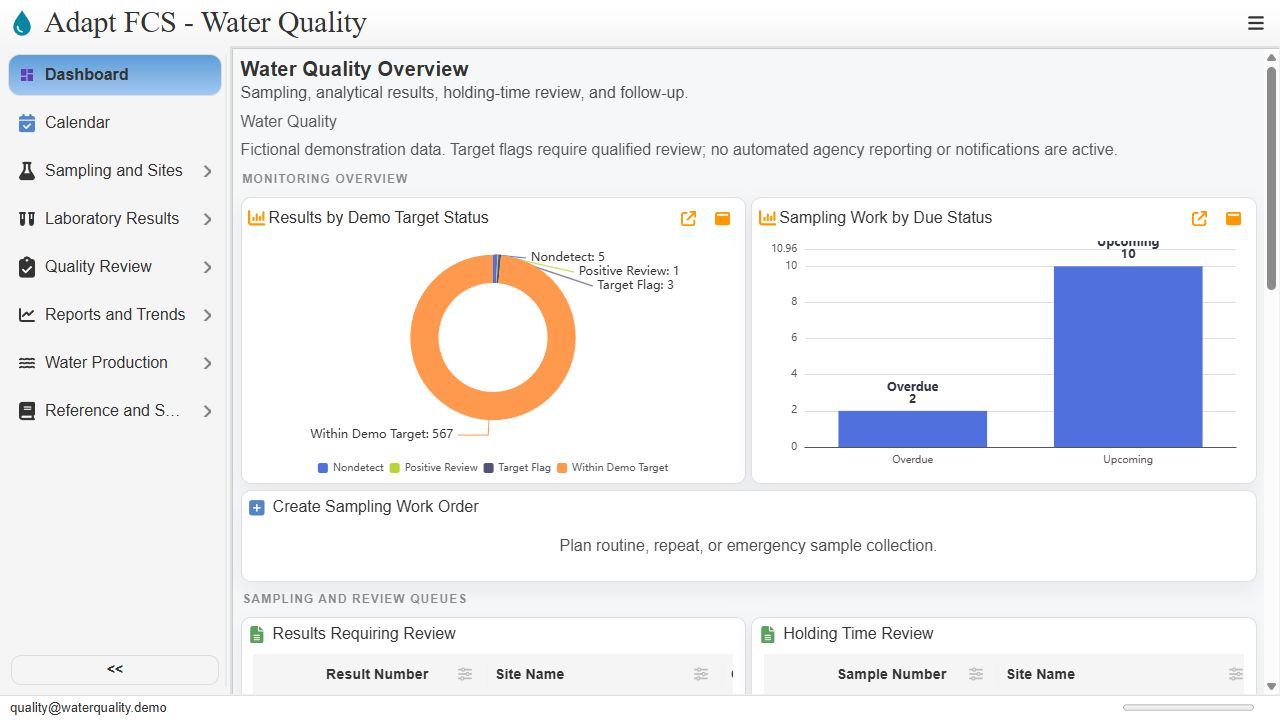
Link to chapterStart on Dashboard in the left menu. The top charts summarize results by demonstration target status and sampling work by due status. These give staff an overview before they inspect individual records. Now, move into the dashboard and scroll down to see the review queues.
Scroll to the review queues
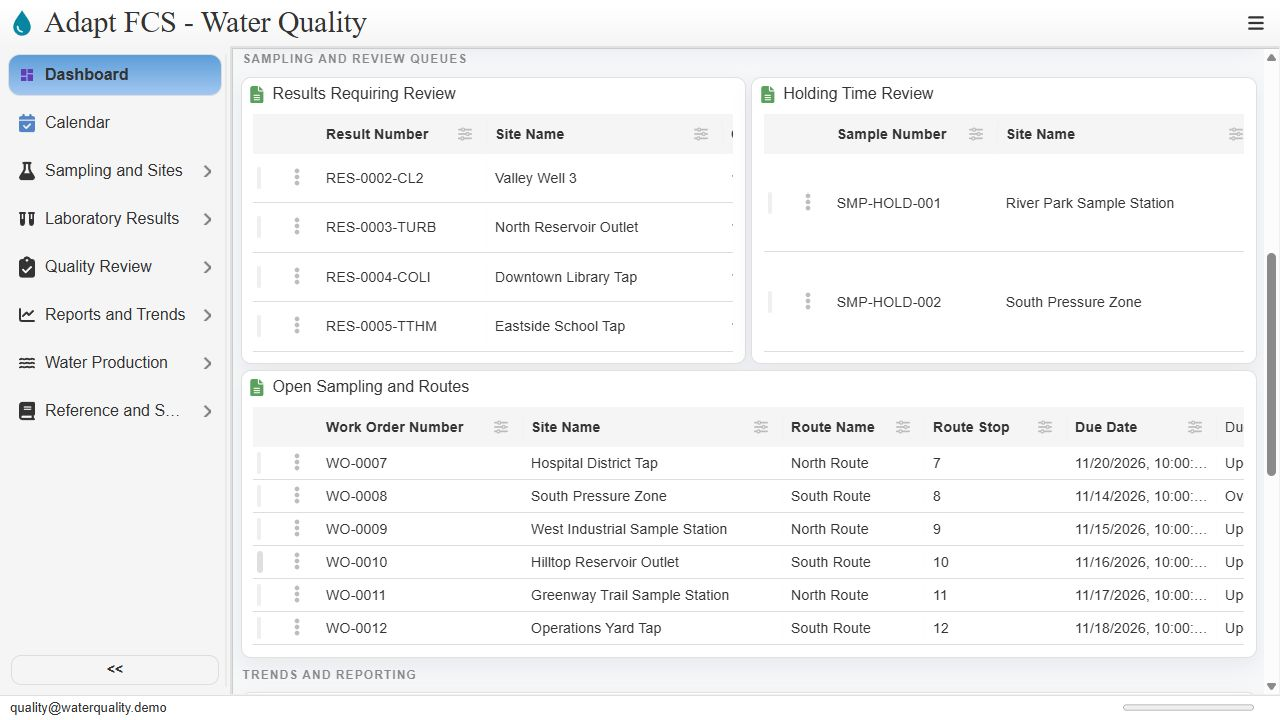
Link to chapterScroll down within the main dashboard area. The results requiring review and holding time panels bring exception records into view. Below them, open sampling and routes show work orders, sites, routes, and due dates. The holding time queue here tracks samples awaiting laboratory receipt; it is not a complete analysis deadline engine.
Continue to trends and reporting
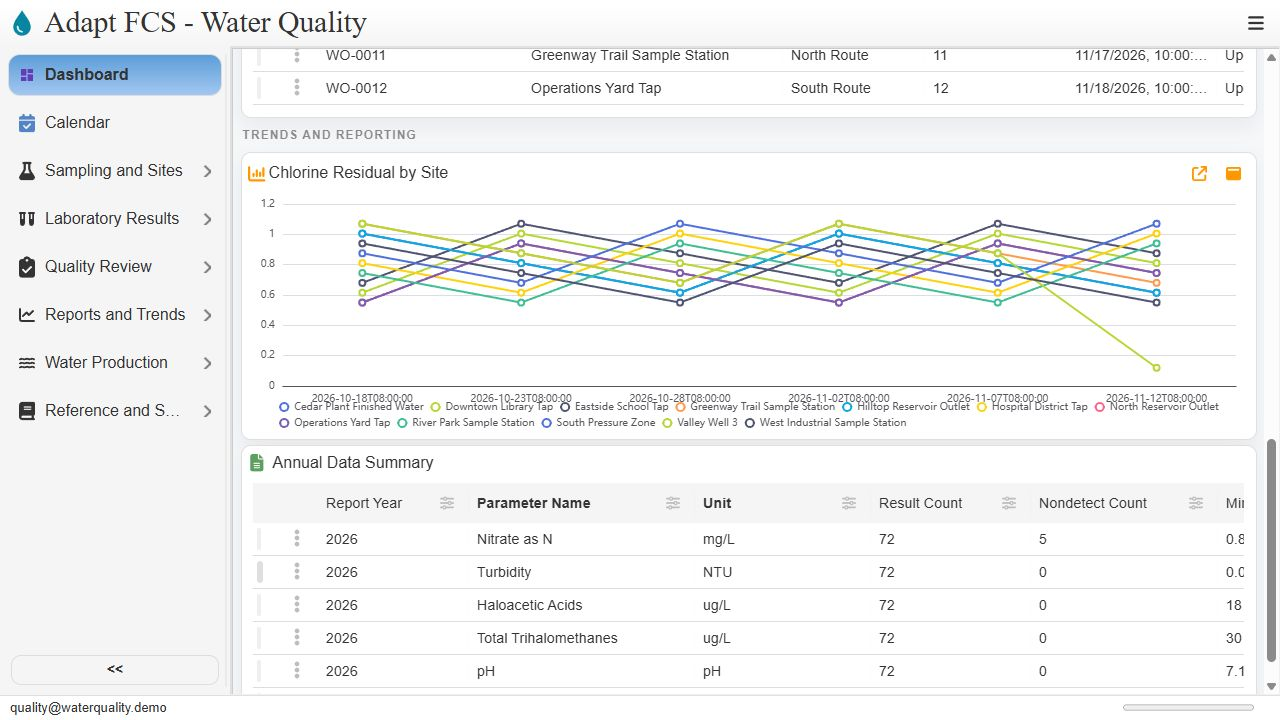
Link to chapterScroll a little farther to Trends and Reporting. The chlorine chart compares recorded residuals across sites and collection dates. The annual summary below counts results and nondetects separately. These are existing demonstration charts and reports. Next, we will use the left menu to inspect the work behind the overview.
Review sampling work
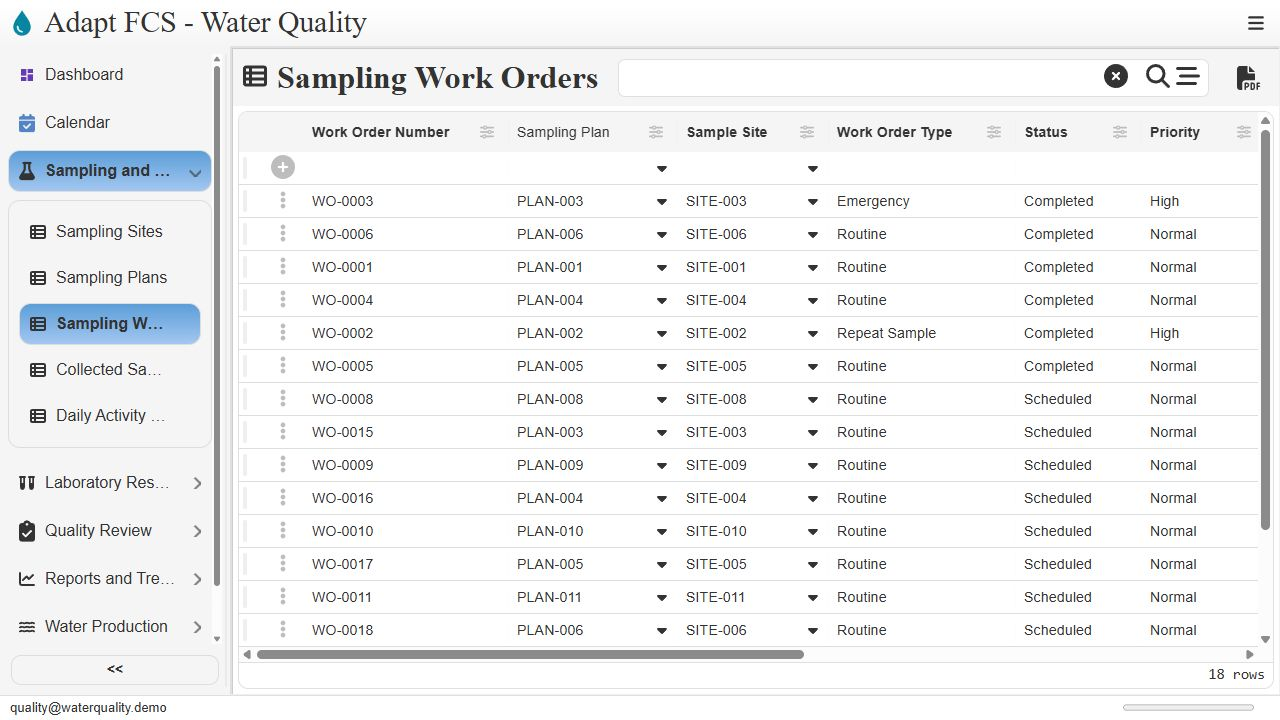
Link to chapterIn the left menu, click Sampling and Sites, then Sampling Work Orders. The register lists routine, repeat, and emergency work, with sites, status, priorities, and assignments. Staff manage these work orders directly in this demonstration. Automatic recurring work creation is outside the workflow shown here.
Inspect a repeat sampling example
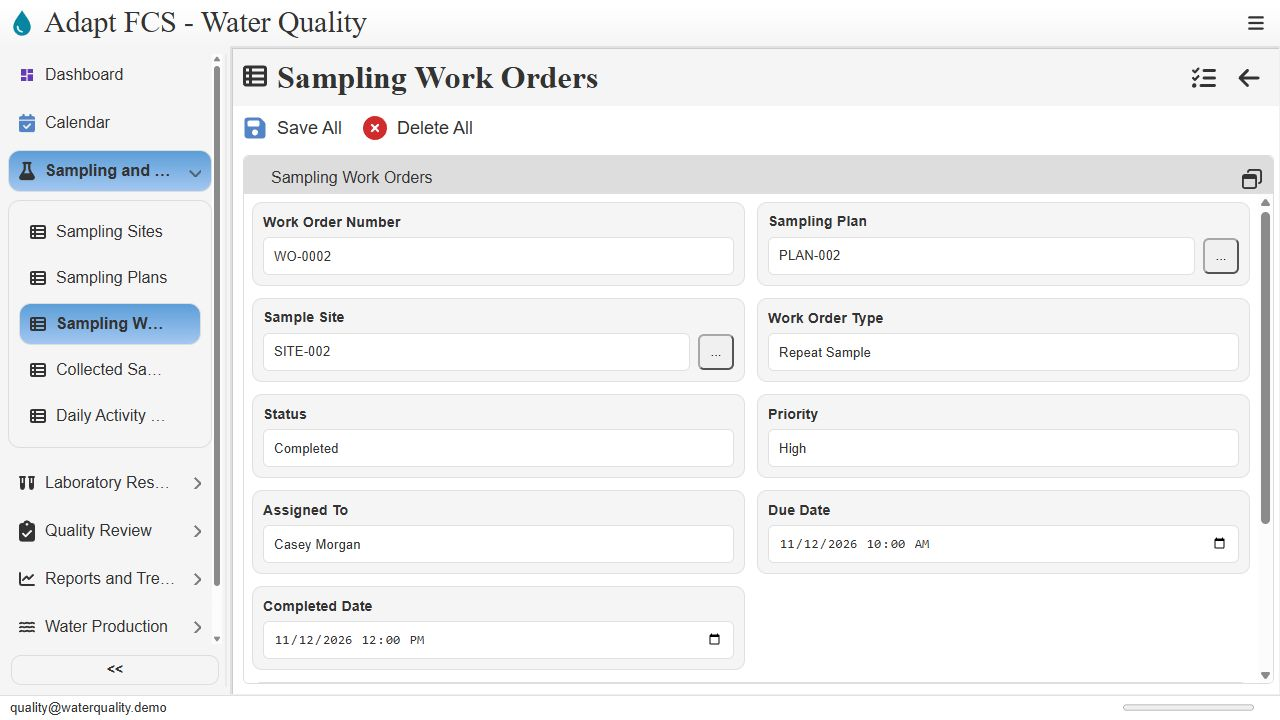
Link to chapterHere is work order W O zero zero zero two, a recorded repeat sampling example. The form shows its high priority, assigned collector, completion information, and investigation instructions. Related collected samples appear in the same record view, making the connection between planned work and collection easy to inspect.
Keep collection details together
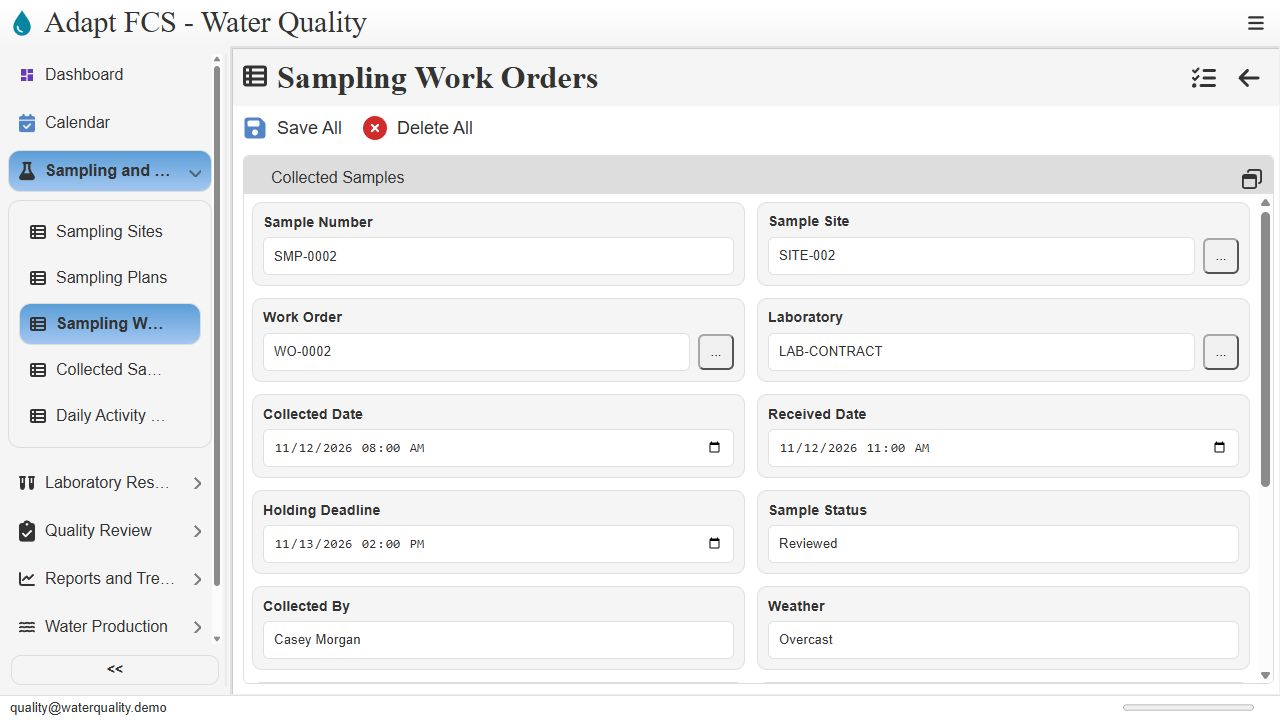
Link to chapterOpening sample S M P zero zero zero two brings together the site, work order, laboratory, collection and receipt times, collector, and chain of custody number. Related analytical results are available below. This gives reviewers a consistent starting point for understanding where a result came from.
Review the result in context
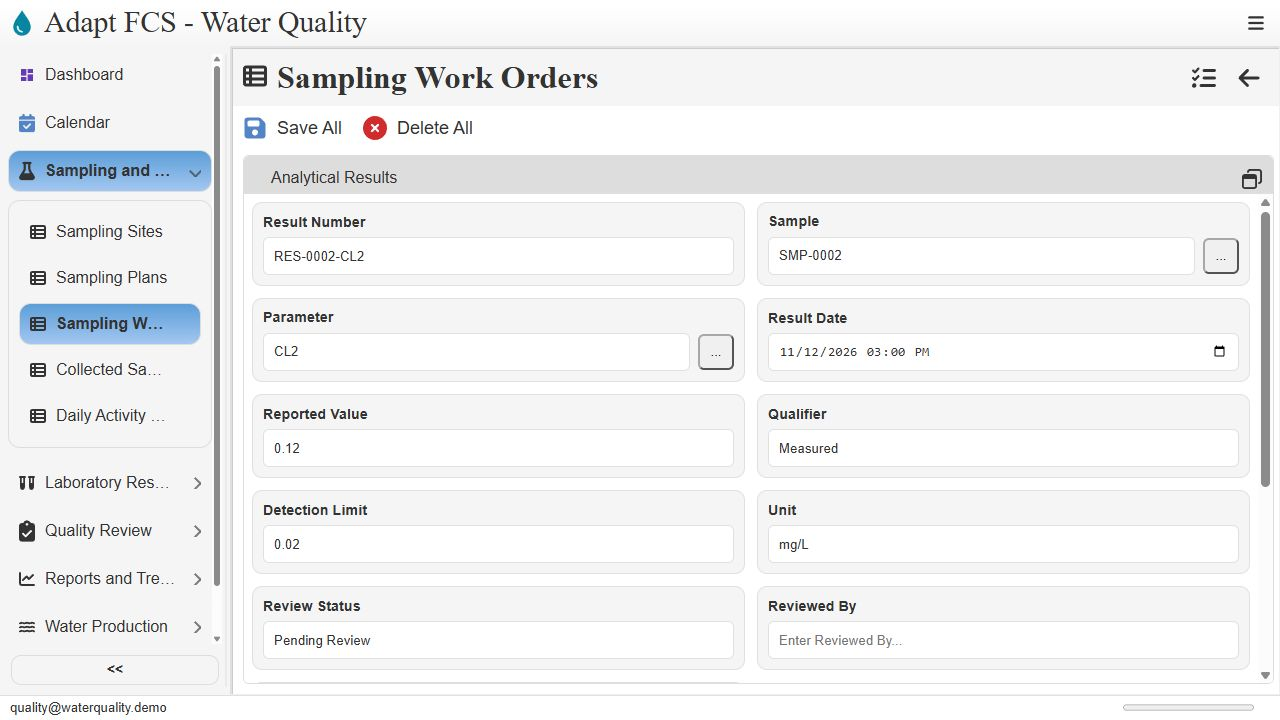
Link to chapterThe chlorine result records a measured value of zero point one two milligrams per liter. Its qualifier, detection limit, laboratory reference, and review status remain visible alongside the value. The notes identify the low residual investigation. This is an illustrative review case, not a determination of regulatory noncompliance.
Make follow-up explicit
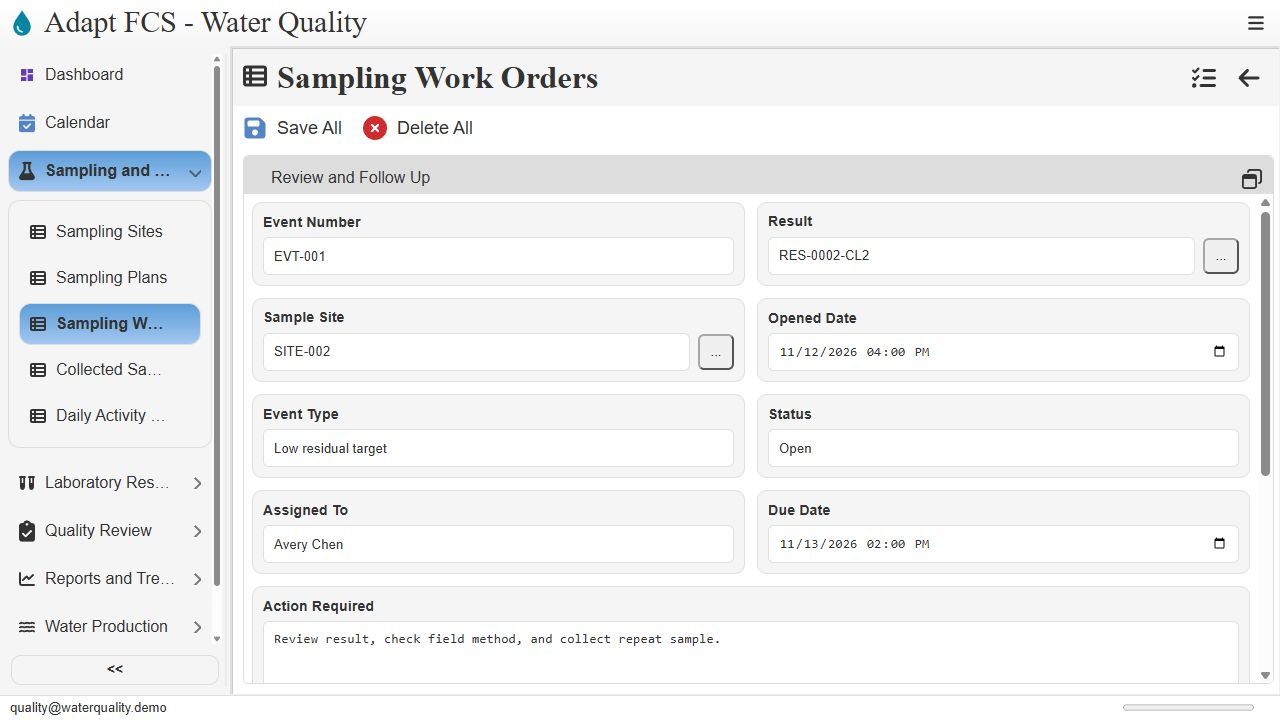
Link to chapterThe related investigation records who is responsible and what should happen next. In this example, Avery Chen is assigned to review the result, check the field method, and collect a repeat sample. Status, due date, required action, and resolution provide a shared place to track the response. We are inspecting existing records rather than changing them.
Open the Result Register
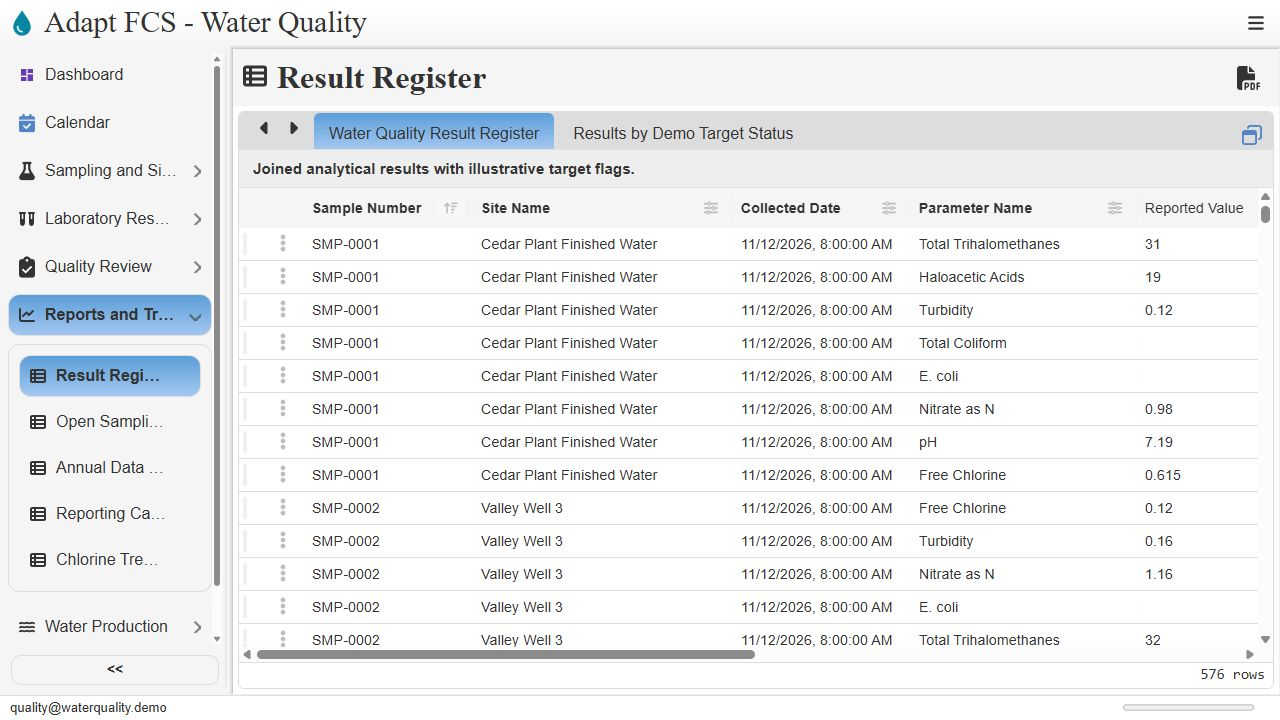
Link to chapterTo inspect results across the system, click Reports and Trends in the left menu, then Result Register. The report joins sample, site, collection date, parameter, and measured value. The column option buttons provide filters for narrowing the records. This is a broader view than the results associated with one sample.
Switch from the report to its chart
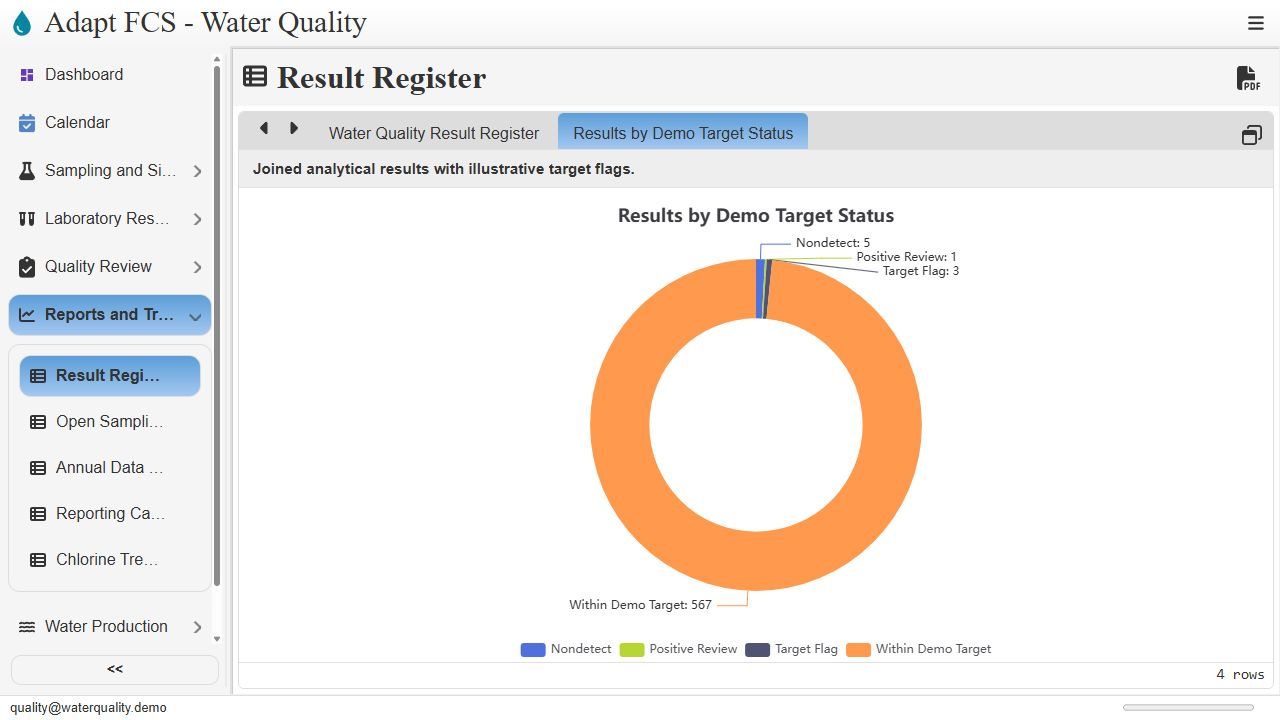
Link to chapterWithin the same pane, click the Results by Demo Target Status tab. The view changes from a table to a chart, showing the distribution of recorded results. Most are within the illustrative target range, while the smaller categories identify exceptions for review. The tabbed layout lets staff move between detail and summary.
Bring the day into perspective
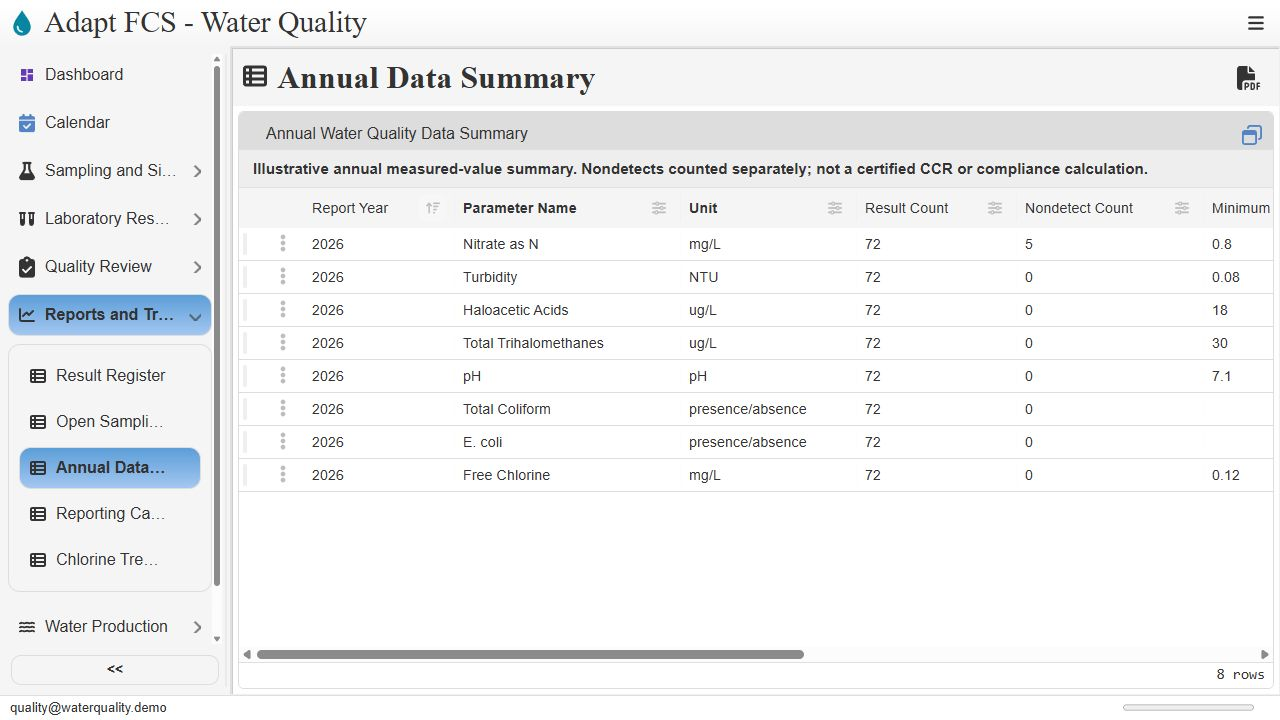
Link to chapterChoose Annual Data Summary from the left menu to review counts and measured value summaries by parameter and unit. Nondetects remain a separate count rather than becoming zero values. This report supports data review, but it is not an approved Consumer Confidence Report or a regulatory compliance calculation.
Check the reporting calendar
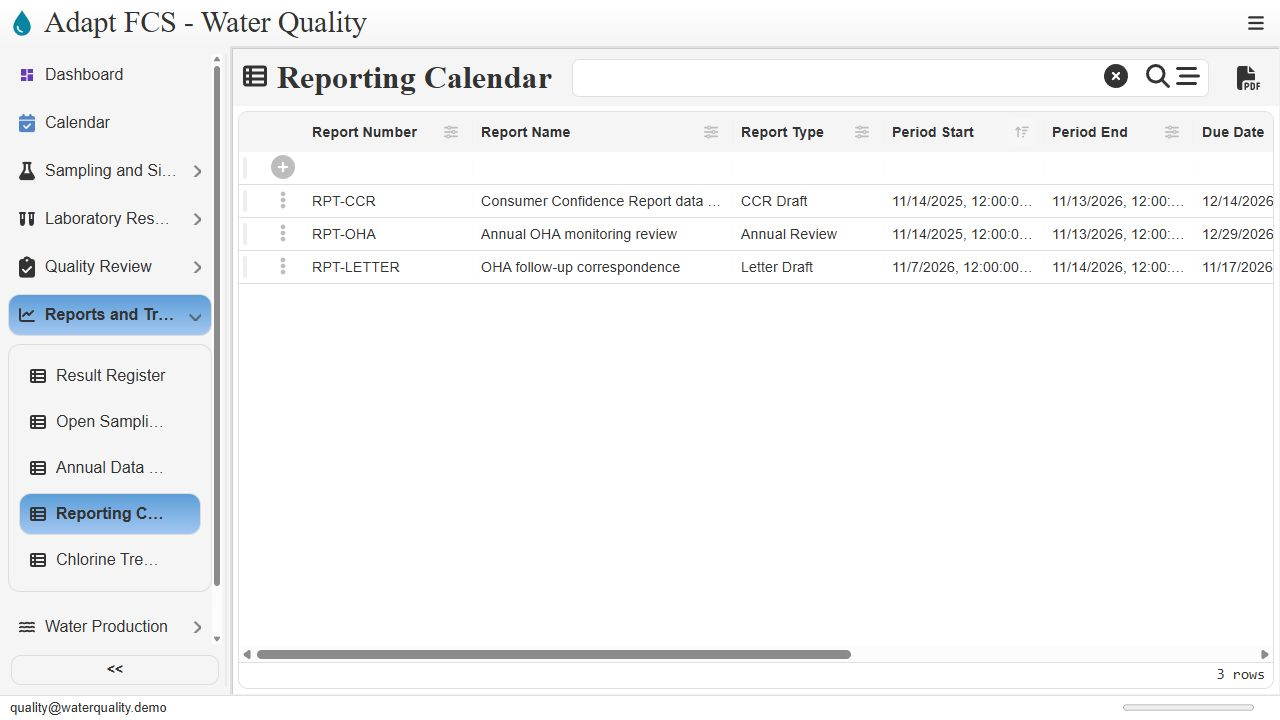
Link to chapterNext, choose Reporting Calendar. The register shows the demonstration reporting obligations, including Consumer Confidence Report preparation, annual monitoring review, and follow-up correspondence. Staff can inspect the reporting periods and due dates. This is a register for tracking preparation; the video does not show automatic agency submission.
One connected daily workflow
Link to chapterClick Dashboard to return to the overview. We have scrolled through the review queues and trends, inspected work and its related records, then opened reports, a chart, and the reporting calendar. That is the existing connected Water Quality workflow, using fictional data in Adapt FCS.
Closing
Link to chapterInstrumental closing; no narration.
No matching chapters. Try another word or clear the search to read the full script.
About this demonstration
The video uses fictional data and illustrative operating targets. It does not determine regulatory compliance or demonstrate agency submissions, live laboratory/GIS/SCADA connections, offline synchronization, or automatic sampling work generation. Staff and contractor sign-in configurations are examples; organization sign-in requires customer-specific setup and verification.
Video access is public. The interactive application has its own sign-in and permission controls. Version 2 · November 2026.