
Water Quality walkthrough
Configure Reports Charts and Dashboards
Inspect existing report and chart definitions, preview an unsaved report, and examine dashboard sections and card sizing using the existing administrator tools.
Download PDF walkthroughFull narration and screenshots, with a link back to this video.
Find what matters to you
Explore the walkthrough
Choose a chapter to play from that point, or read the full narration below.
Read the walkthrough
Narration and screenshots
The complete narration is below. Search the script or use your browser’s Find command. Select any screenshot to view it at full size.
Introduction
Link to chapterAdapt FCS includes administrator tools for shaping reports, charts, and dashboards. This walkthrough inspects existing Water Quality definitions, previews a small unsaved report, and explains how dashboard sections and card sizes affect the working view. All drafts are cancelled, and the existing configuration is preserved.
Inspect saved report definitions
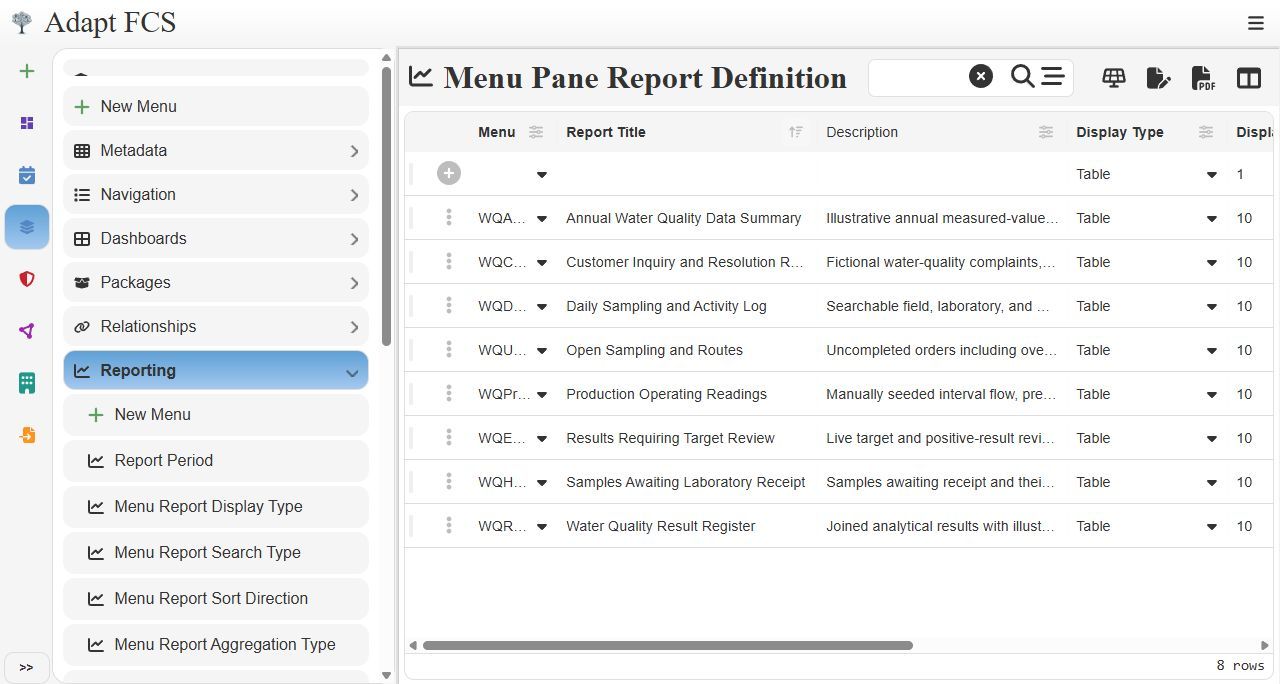
Link to chapterAdministrators can inspect the definitions behind the working views. This register lists existing Water Quality reports, including the result register, sampling queue, holding review, and annual summary. These are configuration records. We are using the existing private administrator site, not granting ordinary demo users access to these tools.
Separate report presentation from its data
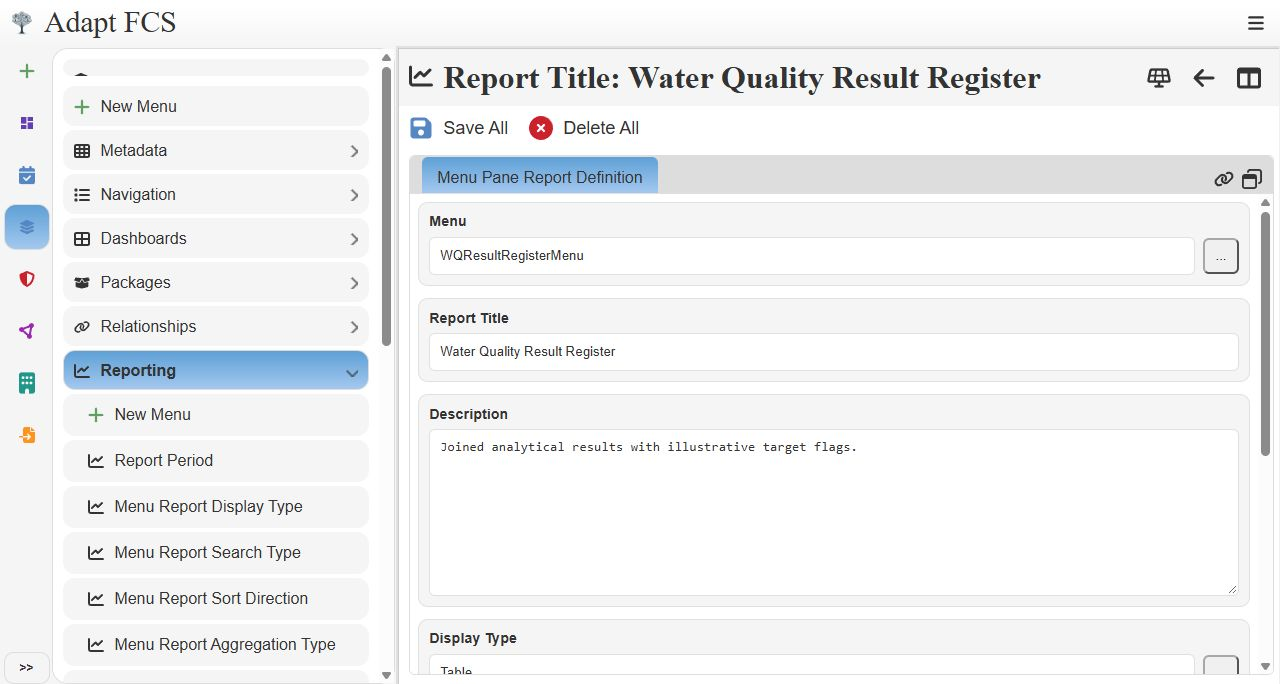
Link to chapterOpening the result-register definition shows its menu association, title, and description. Other settings include display type, ordering, and page size. The underlying query determines the data the report can use. Presentation changes can often be made through configuration, while new calculations or missing data sources may still require development.
Preview a report before creating it
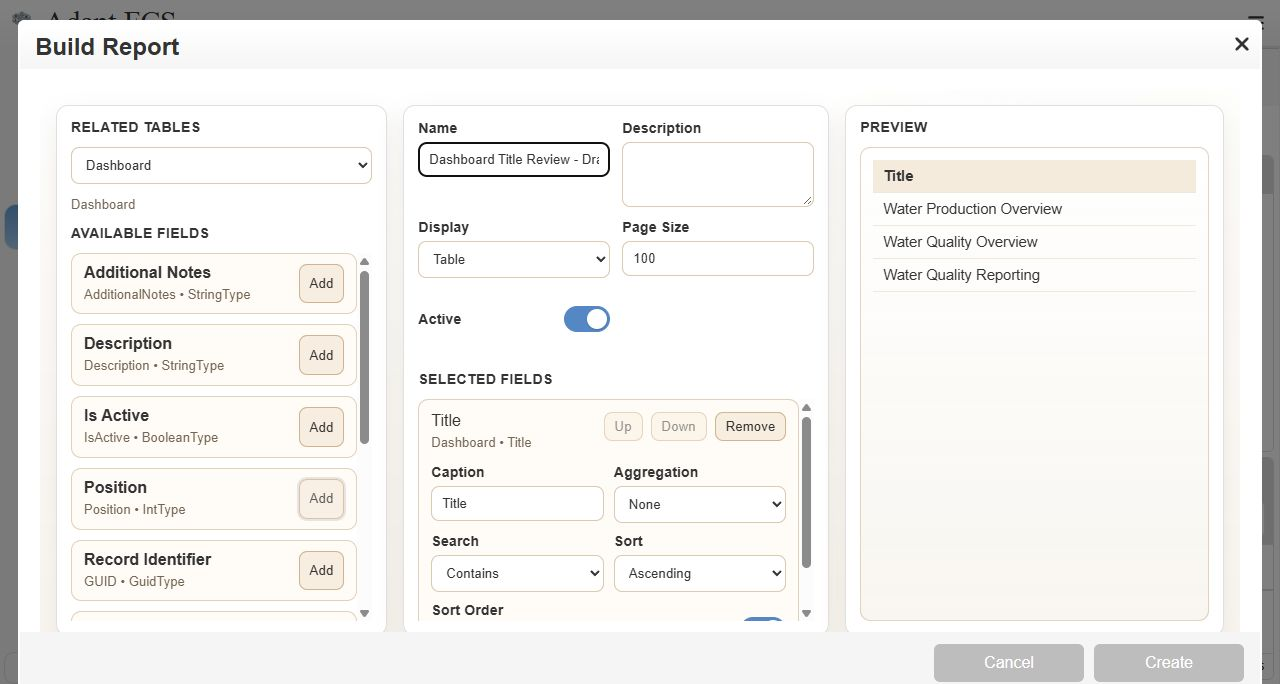
Link to chapterThe Build Report dialog provides related-table and field selection, captions, aggregation, search, and sorting. Here, an unsaved administrator example selects Dashboard Title and sorts it ascending. The preview displays the three existing dashboard titles. We cancel this draft. This is a configuration example, not a newly published operational report or a regulatory output.
Inspect chart presentation settings
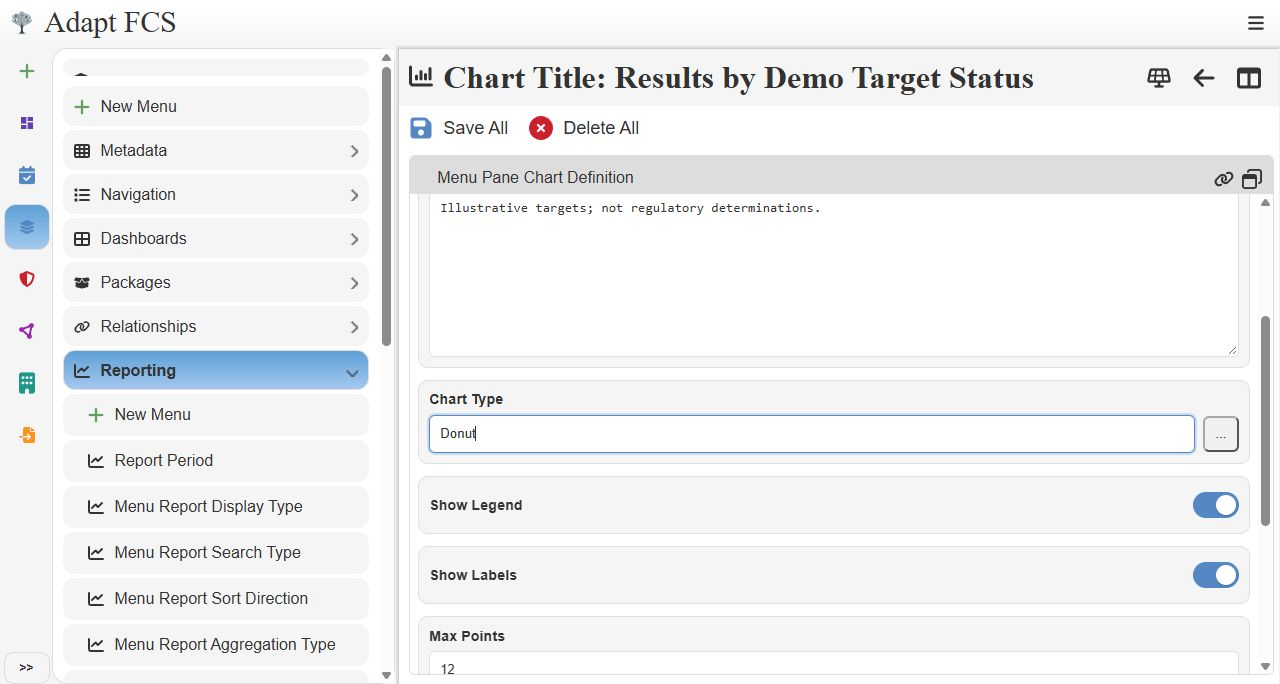
Link to chapterThe existing target-status chart has a Donut chart type, a visible legend, labels, and a maximum point setting. These control presentation. The saved query fields supply the grouping and count used by the chart. A different visual treatment does not validate the underlying thresholds or turn illustrative target flags into regulatory determinations.
Organize a dashboard into sections
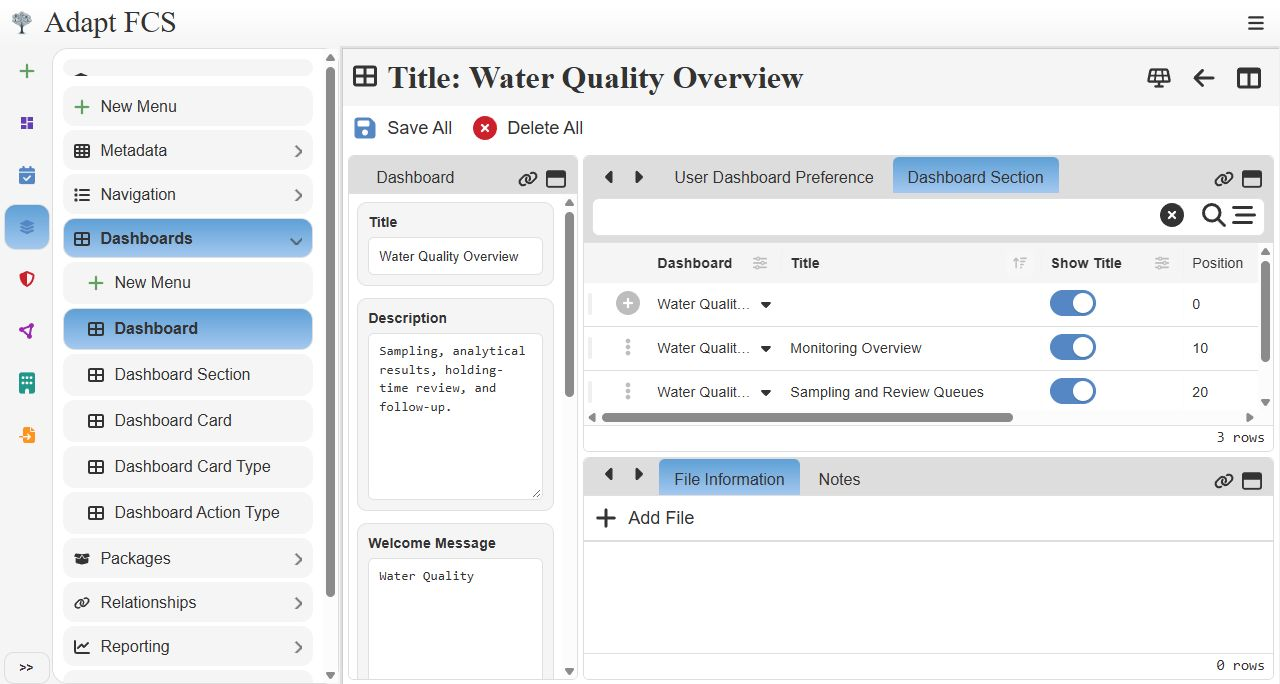
Link to chapterDashboard definitions organize content into named sections. Water Quality Overview has Monitoring Overview, Sampling and Review Queues, and Trends and Reporting. Section titles, position, visibility, and activation settings help organize the working view. These are administrator configuration choices; effective access to the underlying data still needs its own authorization checks.
Set the size and placement of a card
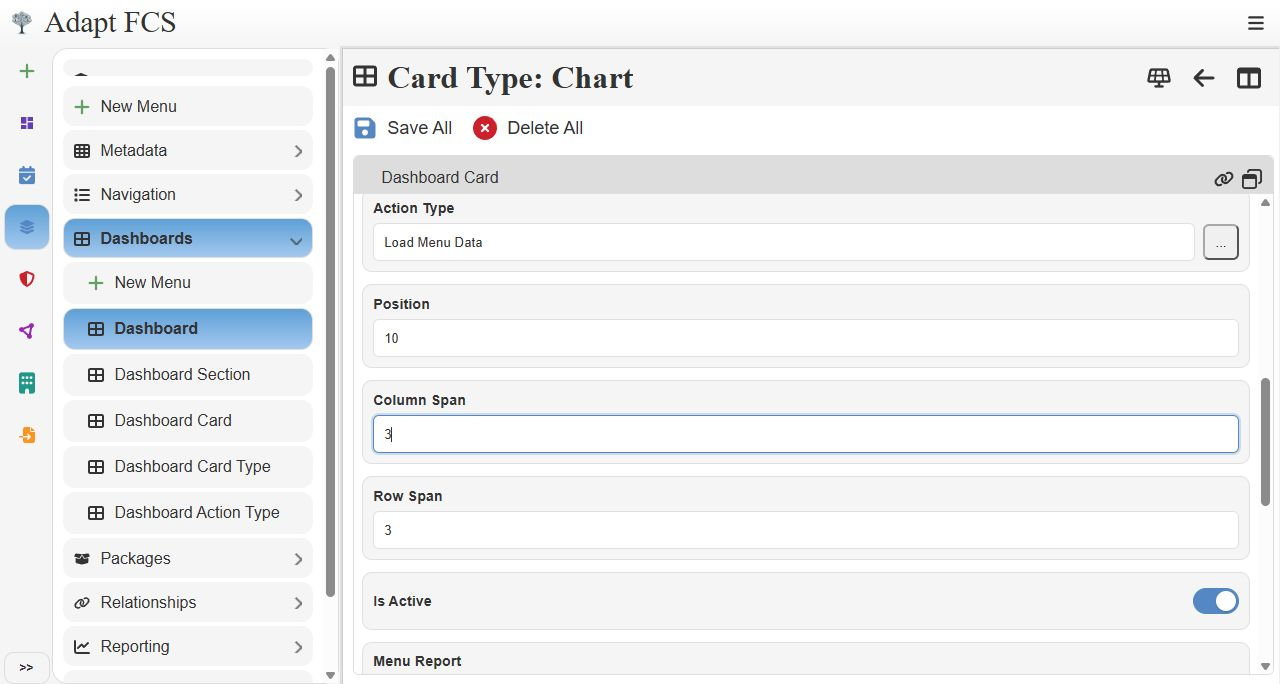
Link to chapterWithin Monitoring Overview, the target-status card refers to the saved chart and its source menu. Position controls ordering, while column and row spans allocate space. This existing card uses three columns and three rows. We inspect the configuration without saving changes, adding a new card, or altering the working dashboard.
Review the existing working result
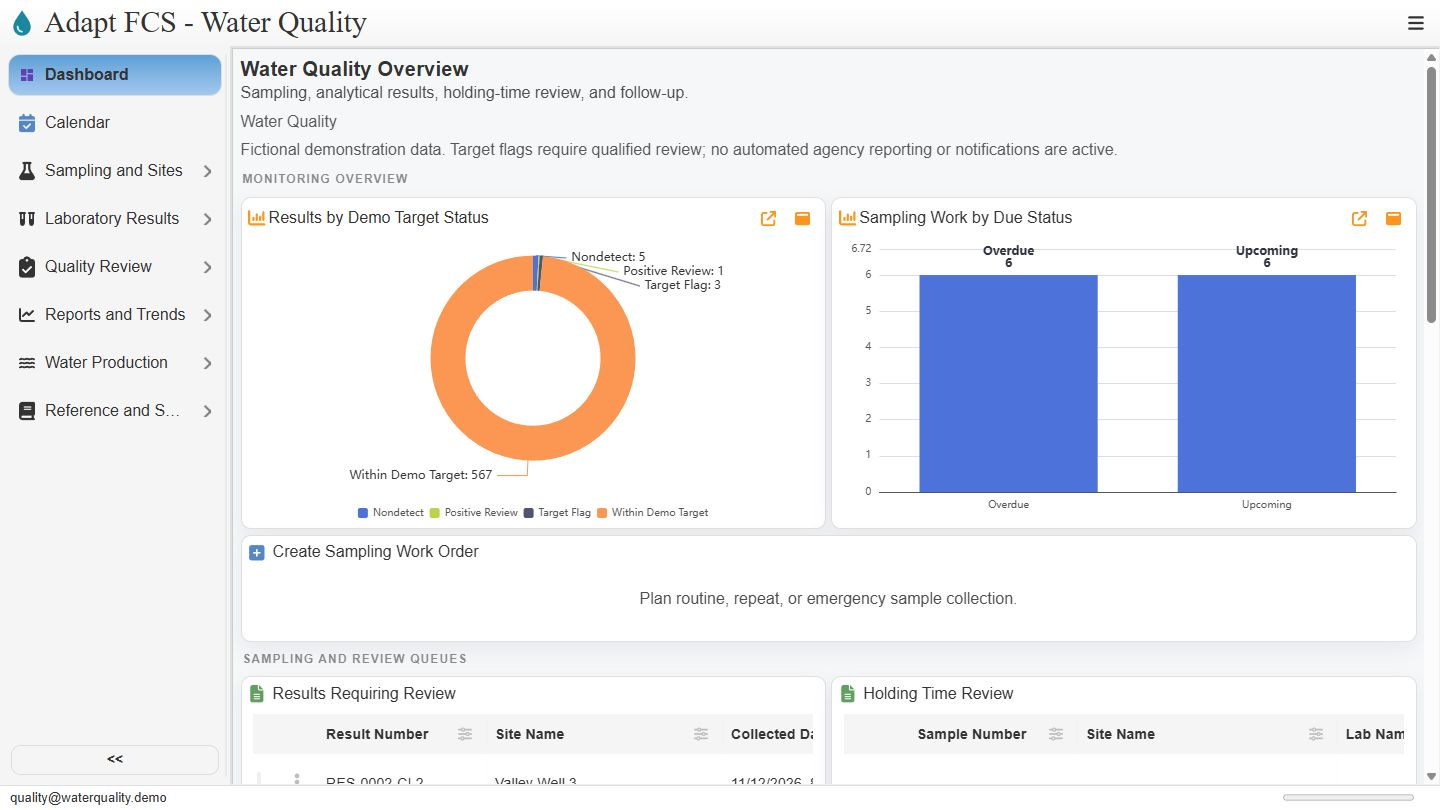
Link to chapterThe working dashboard brings the configured charts and sampling action together. This walkthrough shows how existing definitions, a report preview, chart options, and card layout relate to that experience. A deployment should validate data, permissions, performance, and output before publishing configuration changes. No application development or saved configuration changes were needed for this demonstration.
Closing
Link to chapterInstrumental closing; no narration.
No matching chapters. Try another word or clear the search to read the full script.
About this demonstration
The video uses fictional data and illustrative operating targets. It does not determine regulatory compliance or demonstrate agency submissions, live laboratory/GIS/SCADA connections, offline synchronization, or automatic sampling work generation. Staff and contractor sign-in configurations are examples; organization sign-in requires customer-specific setup and verification.
Video access is public. The interactive application has its own sign-in and permission controls. Version 1 · November 2026.