
Water Quality walkthrough
Reports, Trends, and Reporting Calendar
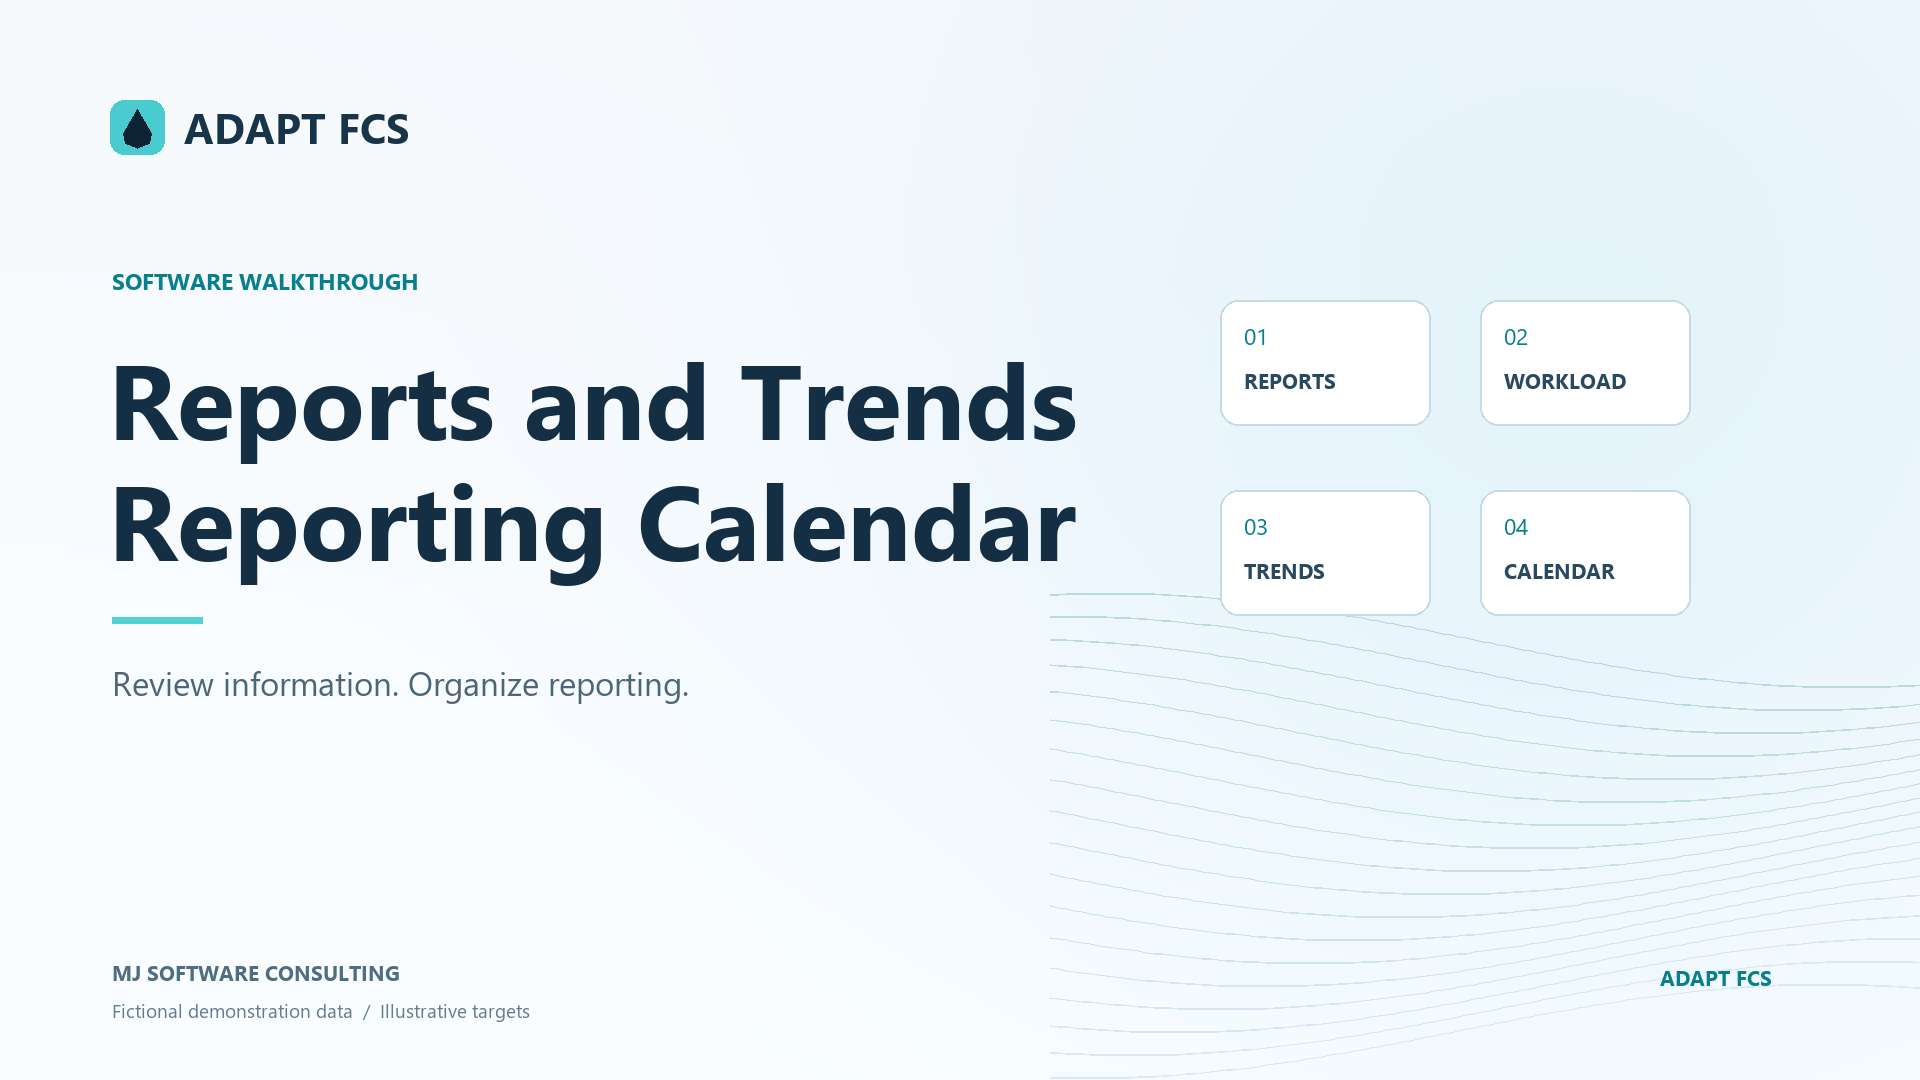
Explore result reports, target and workload charts, chlorine trends, the illustrative annual summary, and manual reporting preparation records.
Download PDF walkthroughFull narration and screenshots, with a link back to this video.
Find what matters to you
Explore the walkthrough
Choose a chapter to play from that point, or read the full narration below.
Read the walkthrough
Narration and screenshots
The complete narration is below. Search the script or use your browser’s Find command. Select any screenshot to view it at full size.
Introduction
Link to chapterExplore the existing reporting tools in Adapt FCS. We will move between combined result reports, review and workload charts, chlorine trends, an illustrative annual summary, and the reporting preparation calendar. This walkthrough distinguishes data review from validated regulatory calculations and agency submission.
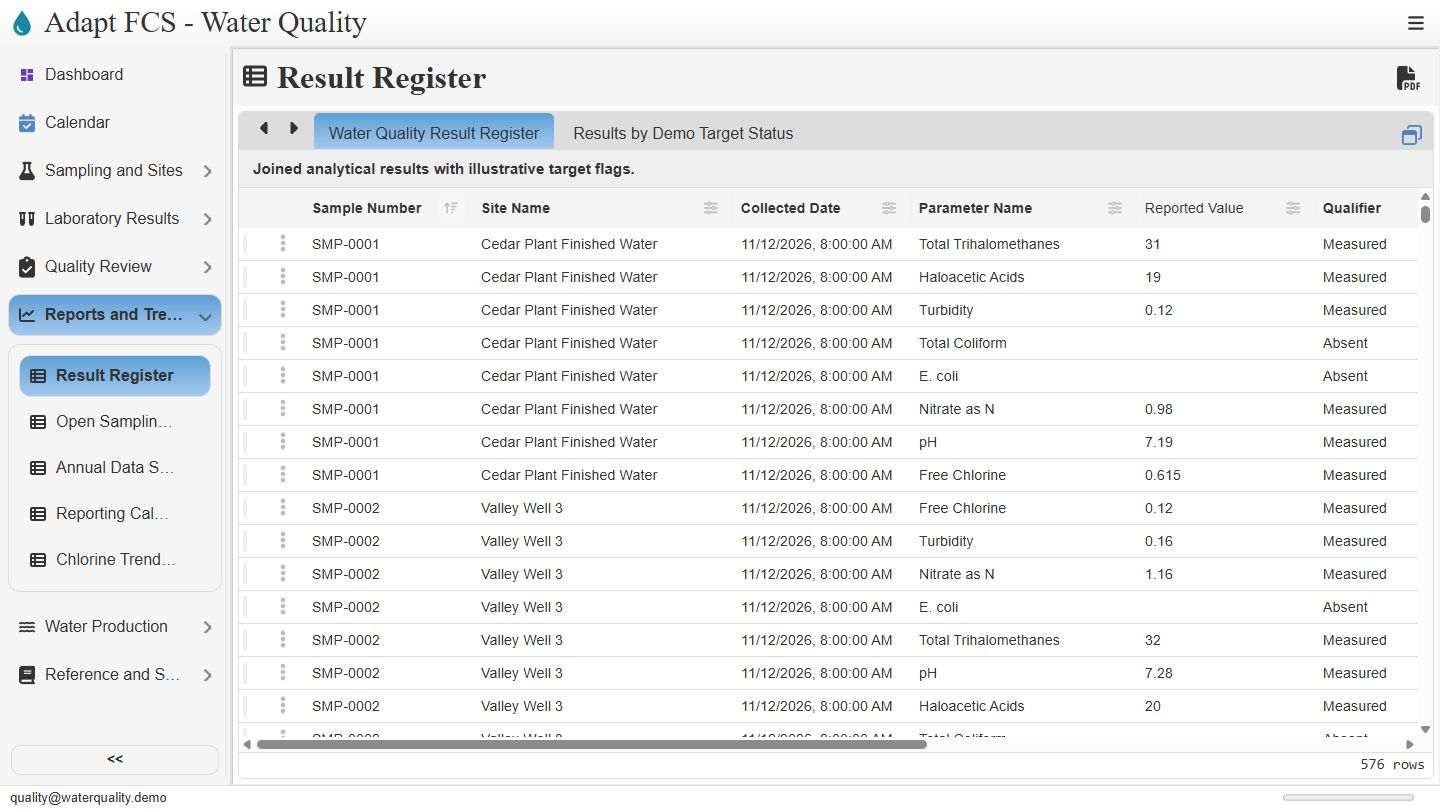
Bring sample and result context together
Link to chapterOpen Reports and Trends and choose Result Register. This joined view brings sample numbers, site names, collection dates, parameter names, values, and qualifiers together. It helps staff review the analytical information in context. The targets used here are illustrative, and the report is not a compliance determination.
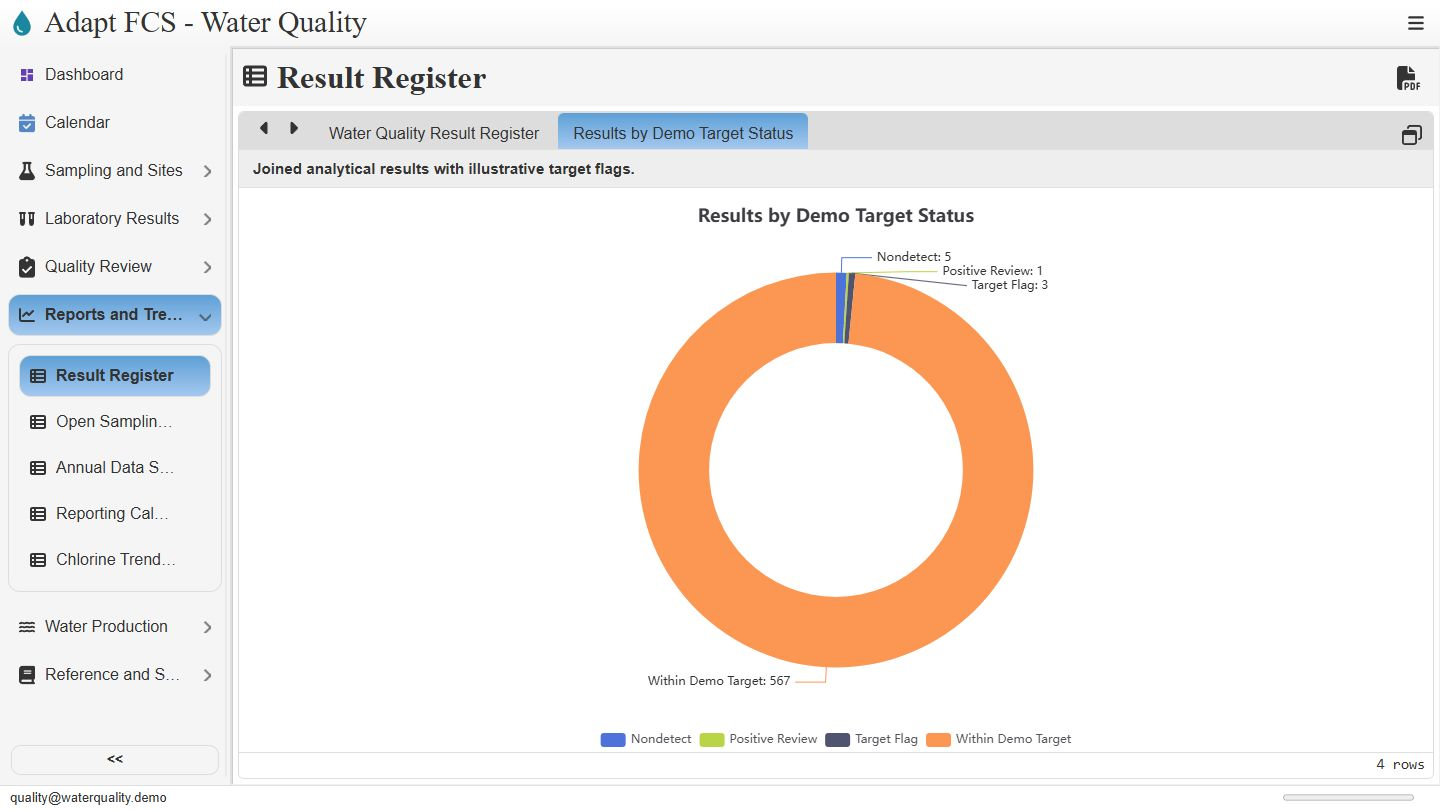
Switch to the result-status chart
Link to chapterSelect Results by Demo Target Status above the report. The chart summarizes measured results within the demo target alongside target flags, a positive-review example, and nondetects. These categories help direct attention to the underlying records. A chart category does not replace the qualified review needed to interpret a result.
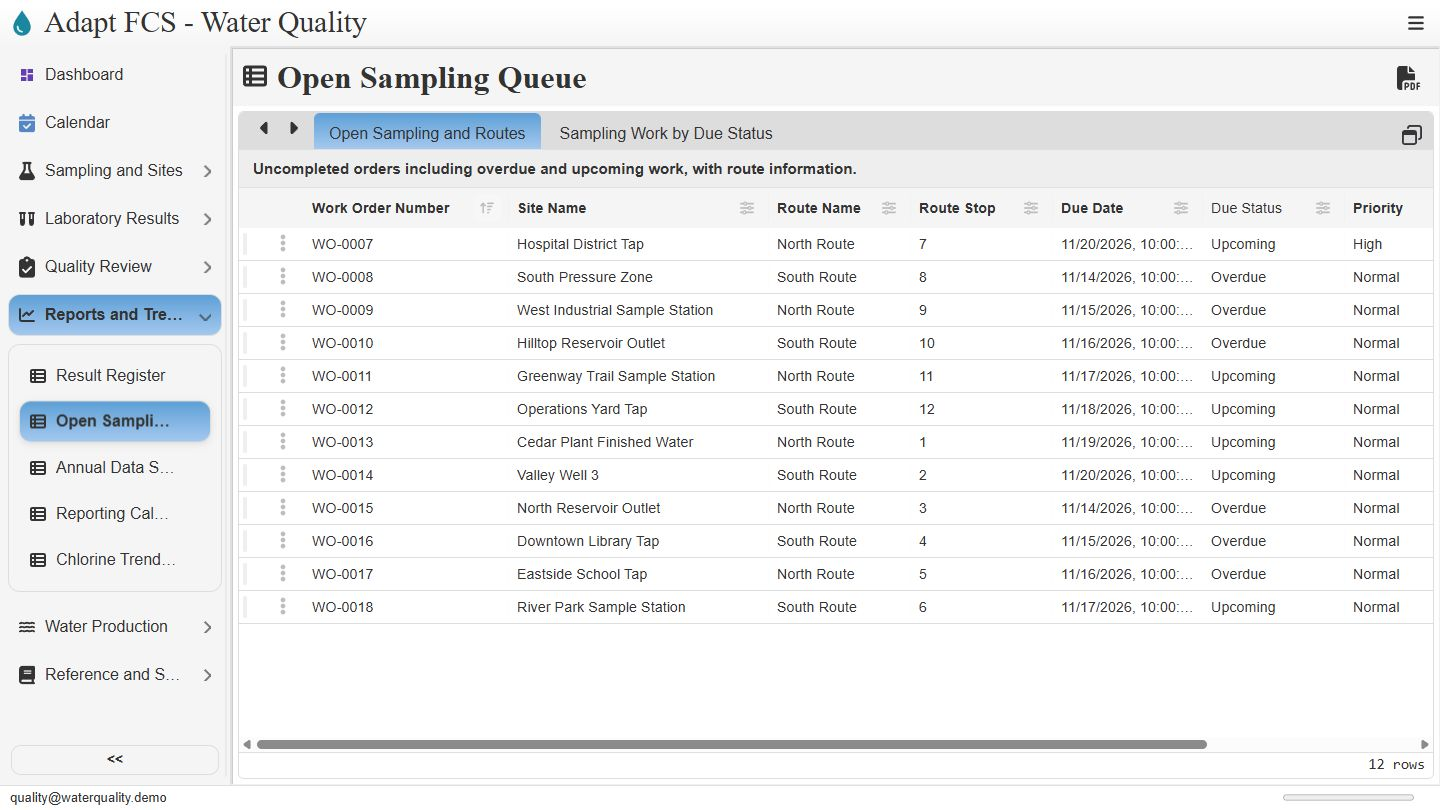
Review open sampling work by route
Link to chapterChoose Open Sampling Queue to review the remaining collection work. The report combines work order identifiers with site names, route names, route stops, due dates, status, and priority. This operational view helps staff organize the recorded tasks. It does not generate recurring work or send a message by itself.
See the due-status workload summary
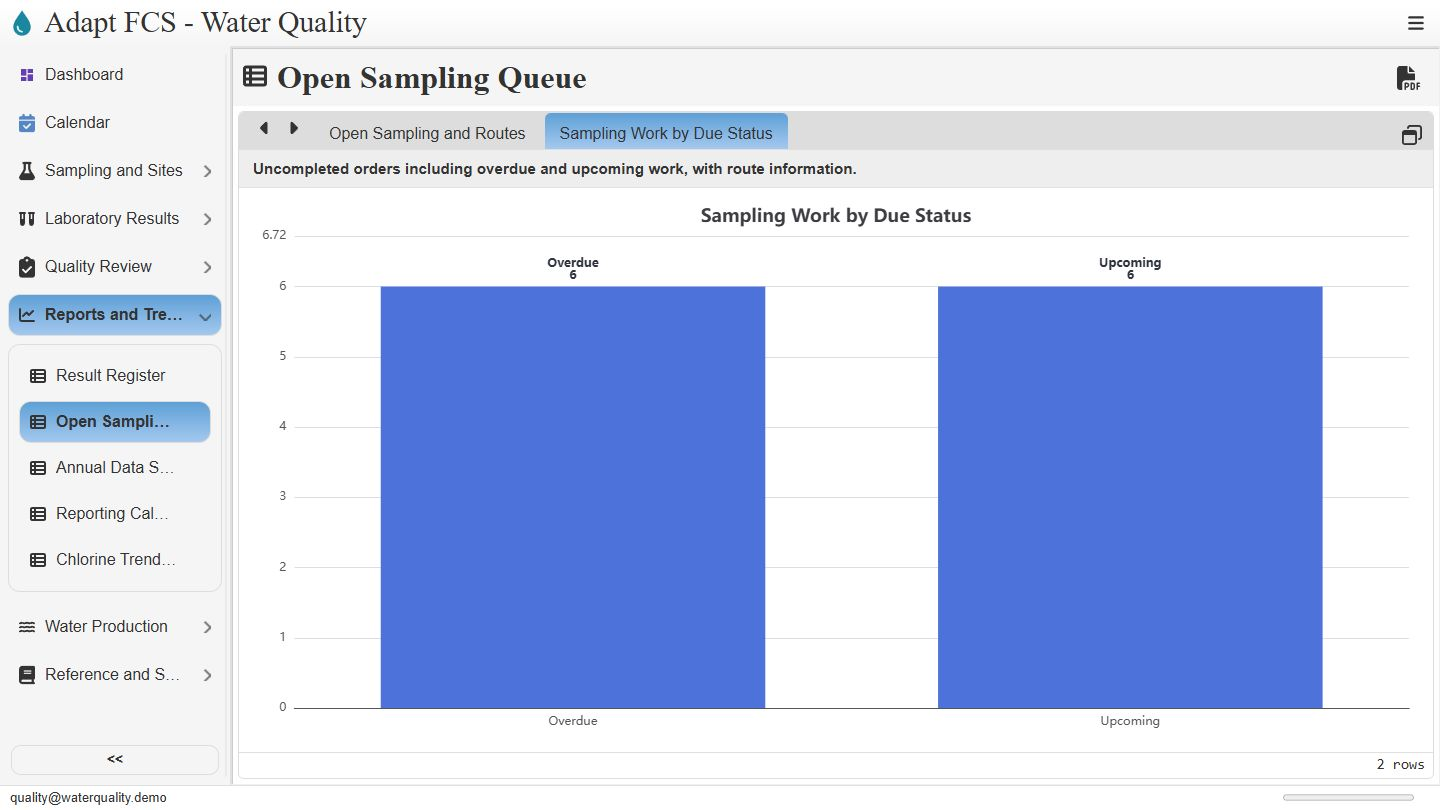
Link to chapterSwitch to Sampling Work by Due Status for a compact workload view. This capture shows six overdue and six upcoming demonstration orders. Use the chart to decide where to inspect individual tasks, then return to the report. Confirm that the underlying report information is current before making operational decisions.
Compare the chlorine histories by site
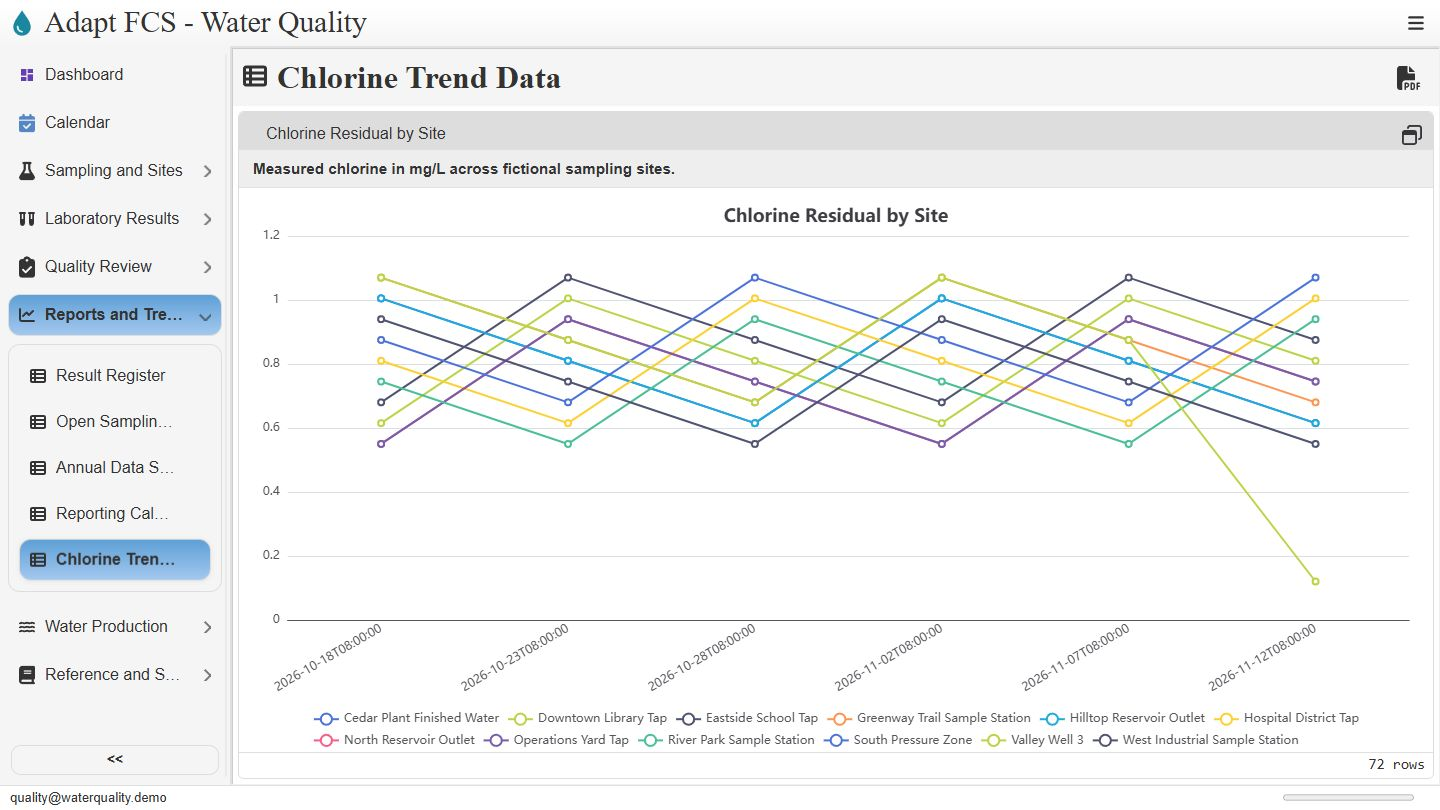
Link to chapterChoose Chlorine Trend Data to view the recorded chlorine series by site. Each colored series corresponds to a fictional sampling location, with the reading dates along the bottom. The view supports comparison across locations and time. It does not infer the cause of a change or certify that an operating condition is acceptable.
Use the annual summary as a review starting point
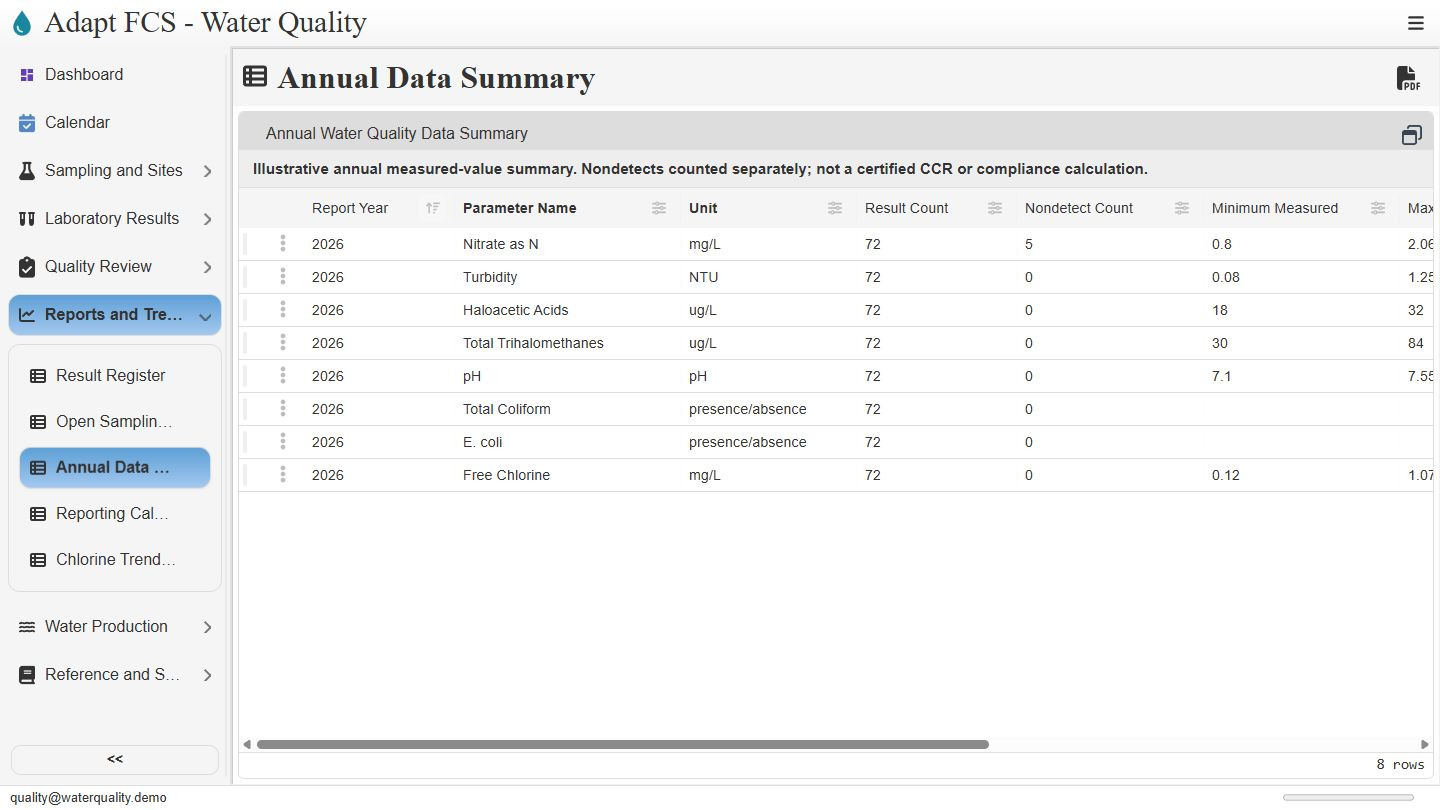
Link to chapterAnnual Data Summary groups the demonstration results by parameter and unit. It retains a separate nondetect count while summarizing measured values. The notice explicitly says this is not a certified Consumer Confidence Report or compliance calculation. Approved regulatory periods, averaging rules, nondetect treatment, and final report content need independent validation.
Organize the reporting preparation work
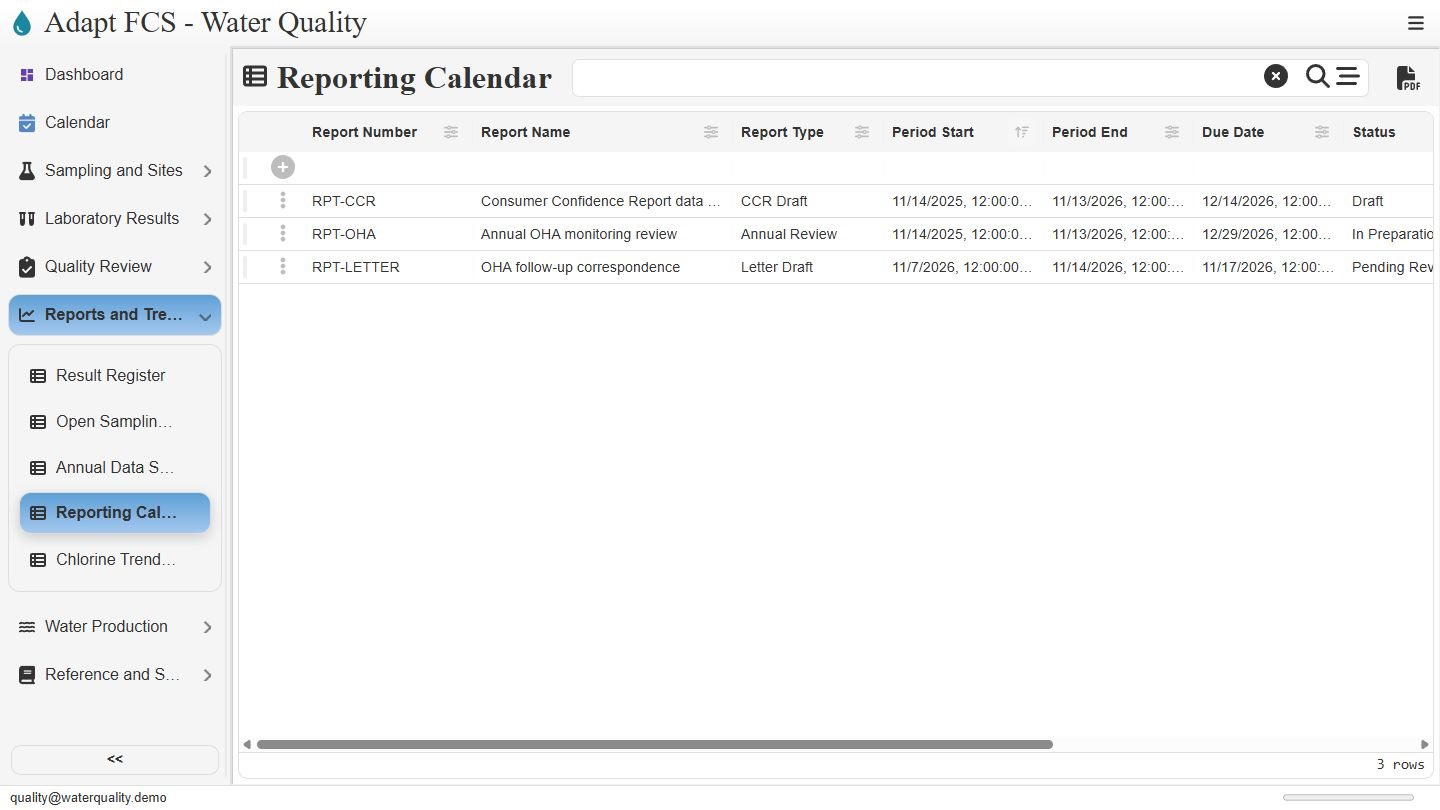
Link to chapterOpen Reporting Calendar to see the preparation records. The examples include Consumer Confidence Report data review, annual monitoring review, and follow-up correspondence. Each records a reporting period, due date, status, and preparer. This register organizes the work; it does not submit the document to an agency.
Inspect the preparation record and its scope
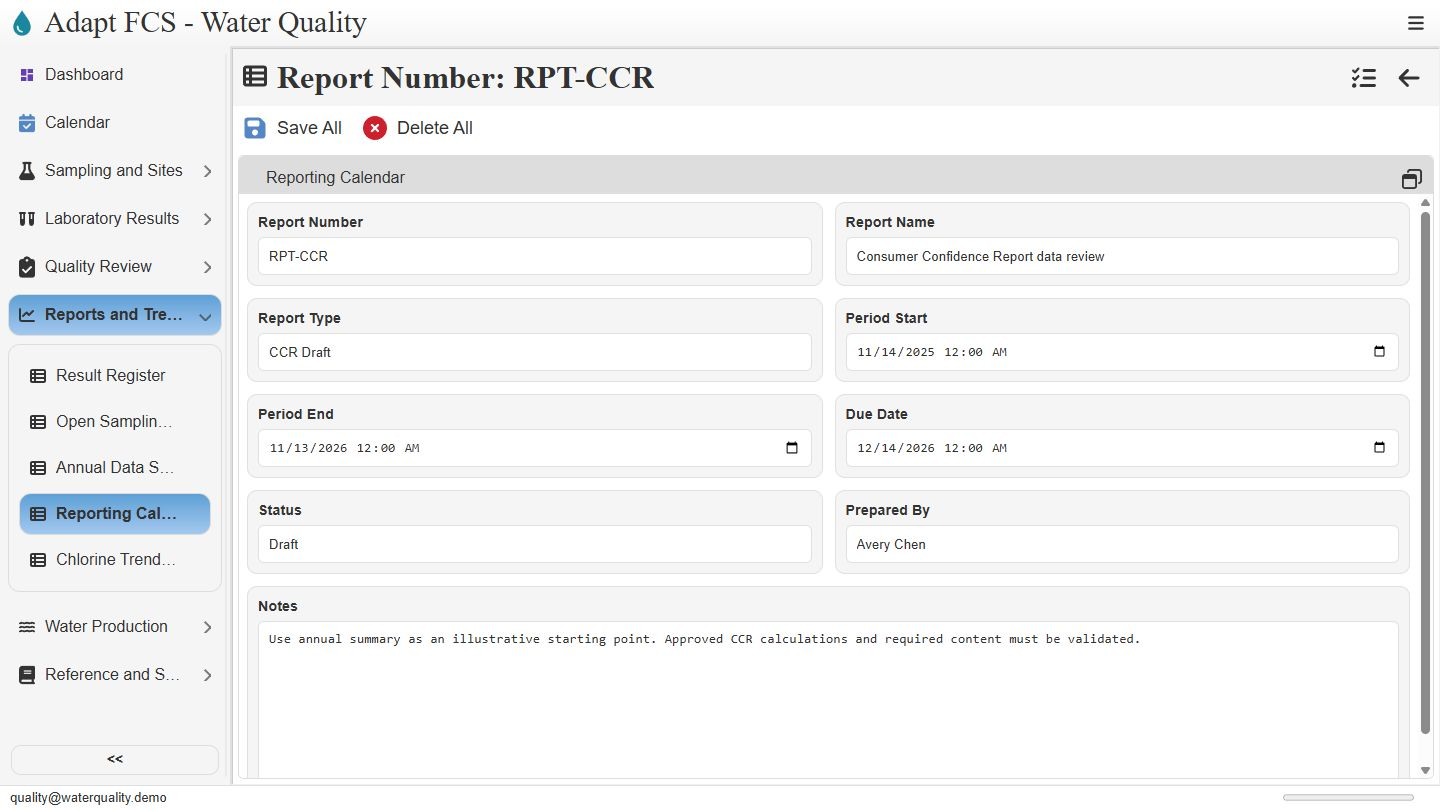
Link to chapterOpen the Consumer Confidence Report data-review example. Its reporting period, due date, Draft status, preparer, and note are visible together. The note requires approved calculations and required content to be validated. These tools support preparation and review today. Agency-specific outputs, electronic submission, and regulatory certification are separate work.
Closing
Link to chapterInstrumental closing; no narration.
No matching chapters. Try another word or clear the search to read the full script.
About this demonstration
The video uses fictional data and illustrative operating targets. It does not determine regulatory compliance or demonstrate agency submissions, live laboratory/GIS/SCADA connections, offline synchronization, or automatic sampling work generation. Staff and contractor sign-in configurations are examples; organization sign-in requires customer-specific setup and verification.
Video access is public. The interactive application has its own sign-in and permission controls. Version 1 · November 2026.