
Water Quality walkthrough
Role-Based Workspaces
Compare the three demonstration sign-in choices and their quality, production, and reporting dashboards, with access-validation limits clearly explained.
Download PDF walkthroughFull narration and screenshots, with a link back to this video.
Find what matters to you
Explore the walkthrough
Choose a chapter to play from that point, or read the full narration below.
Read the walkthrough
Narration and screenshots
The complete narration is below. Search the script or use your browser’s Find command. Select any screenshot to view it at full size.
Introduction
Link to chapterA useful system gives different people a relevant place to start. This walkthrough compares the Water Quality, Water Production, and Reporting workspaces, explains why the login options are customizable examples, and distinguishes dashboard presentation from permissions that still require deployment verification.
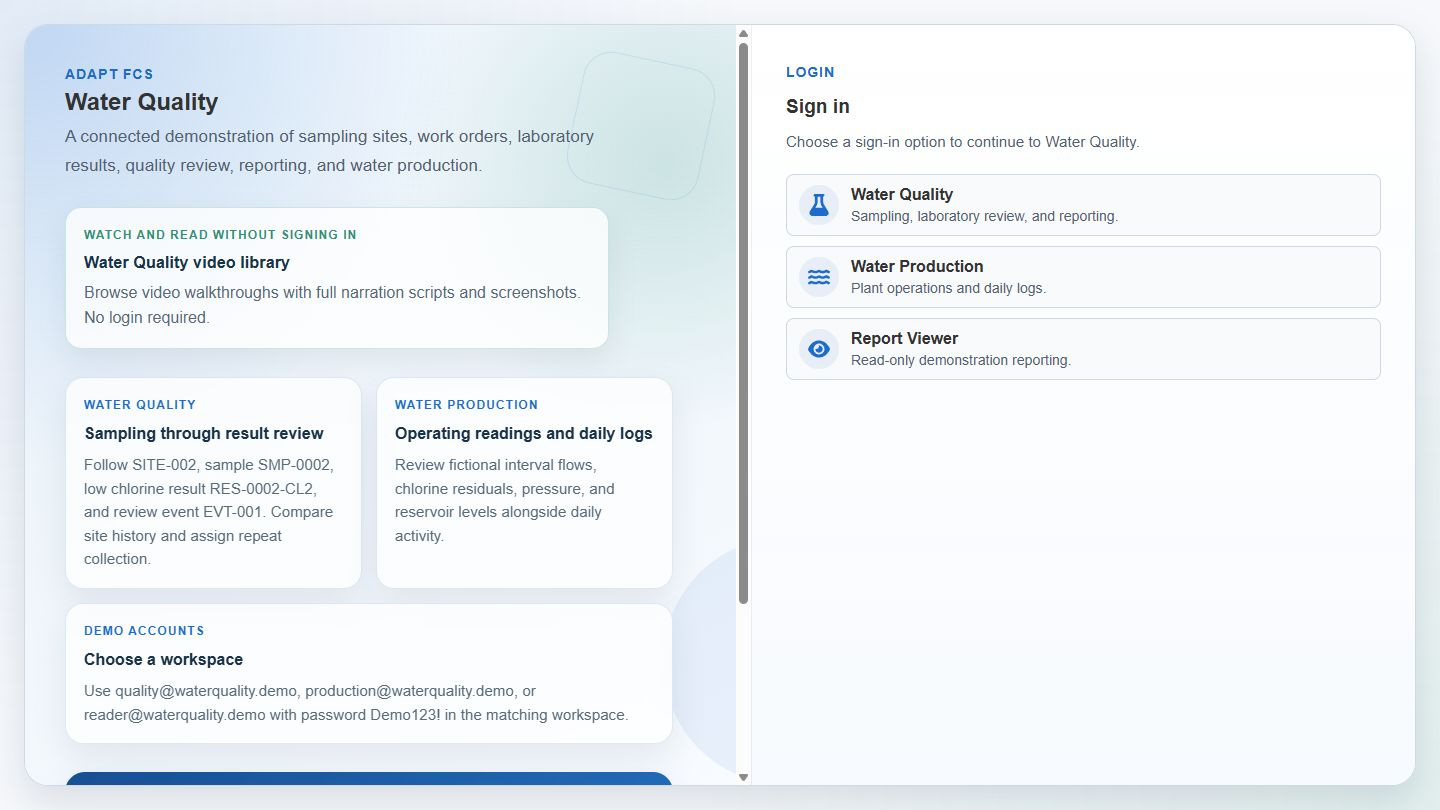
Choose a workspace
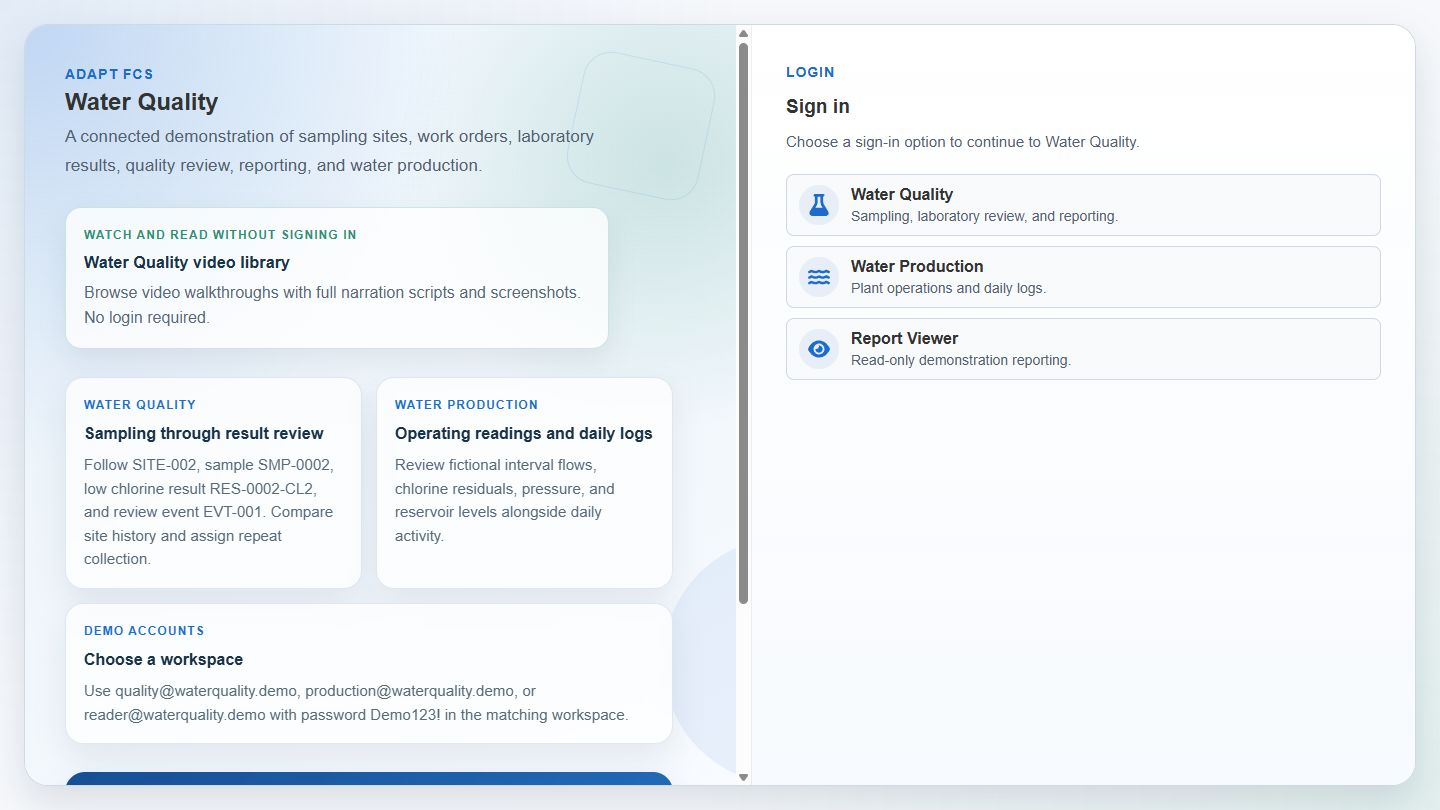
Link to chapterThe Water Quality login page offers three demonstration choices. These showcase how the entry experience can be customized for different audiences. In this example, all three use local demo accounts. They are not a demonstration of three separate identity providers, and choosing a button alone does not grant authorization.
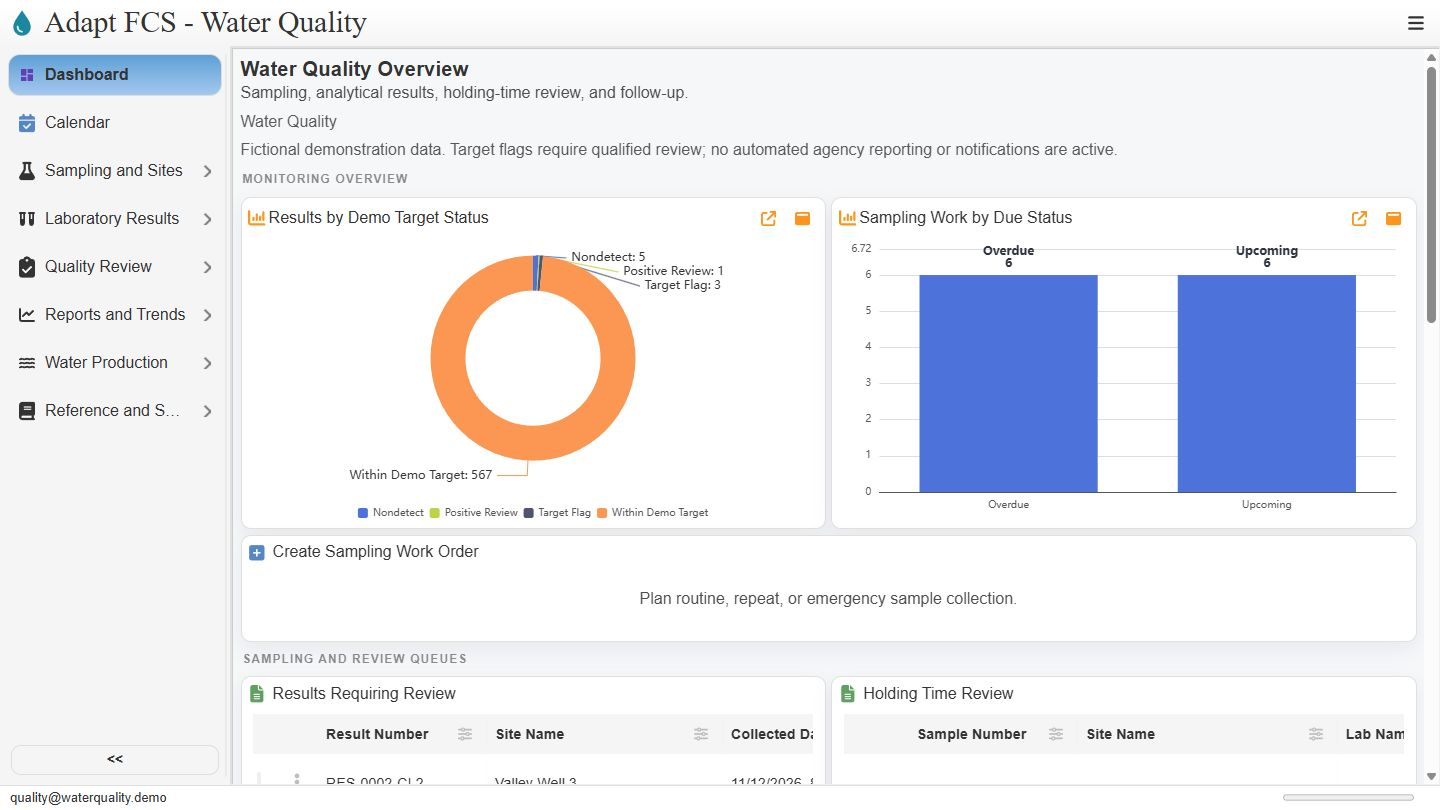
Start with water quality
Link to chapterThe quality account opens the Water Quality Overview. Its dashboard brings target-status monitoring, sampling workload, review queues, and reporting information together. This gives sampling and laboratory staff a practical starting point for the day. The navigation remains recognizable across the workspaces, so staff can move into the relevant registers.
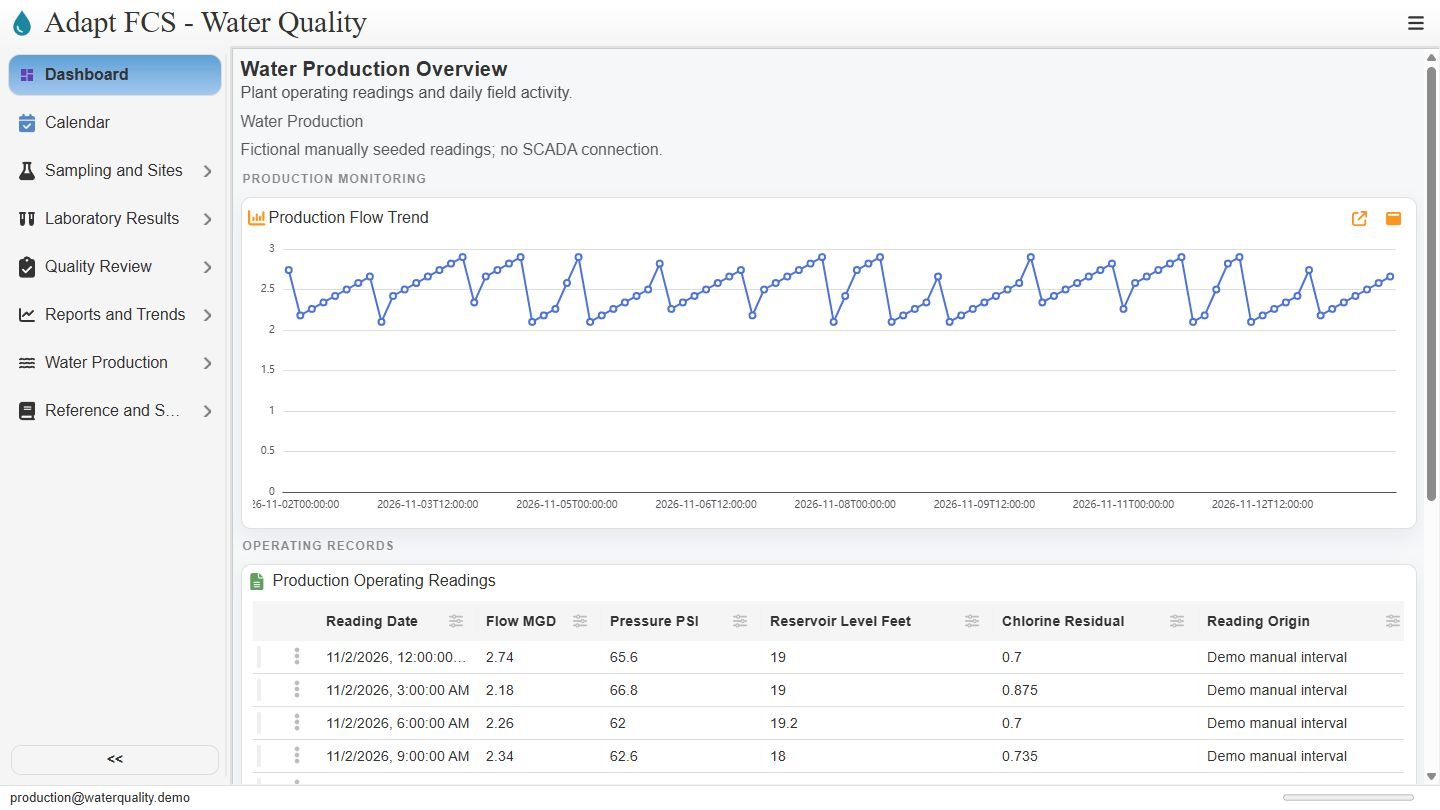
Switch to production context
Link to chapterThe production account instead opens Water Production Overview. Here, the leading chart shows the seeded flow history, with operating readings below. This is a different default working view over the same demonstration tenant. The readings are fictional manual records; this screen does not establish a live connection to plant equipment.
Provide a reporting starting point
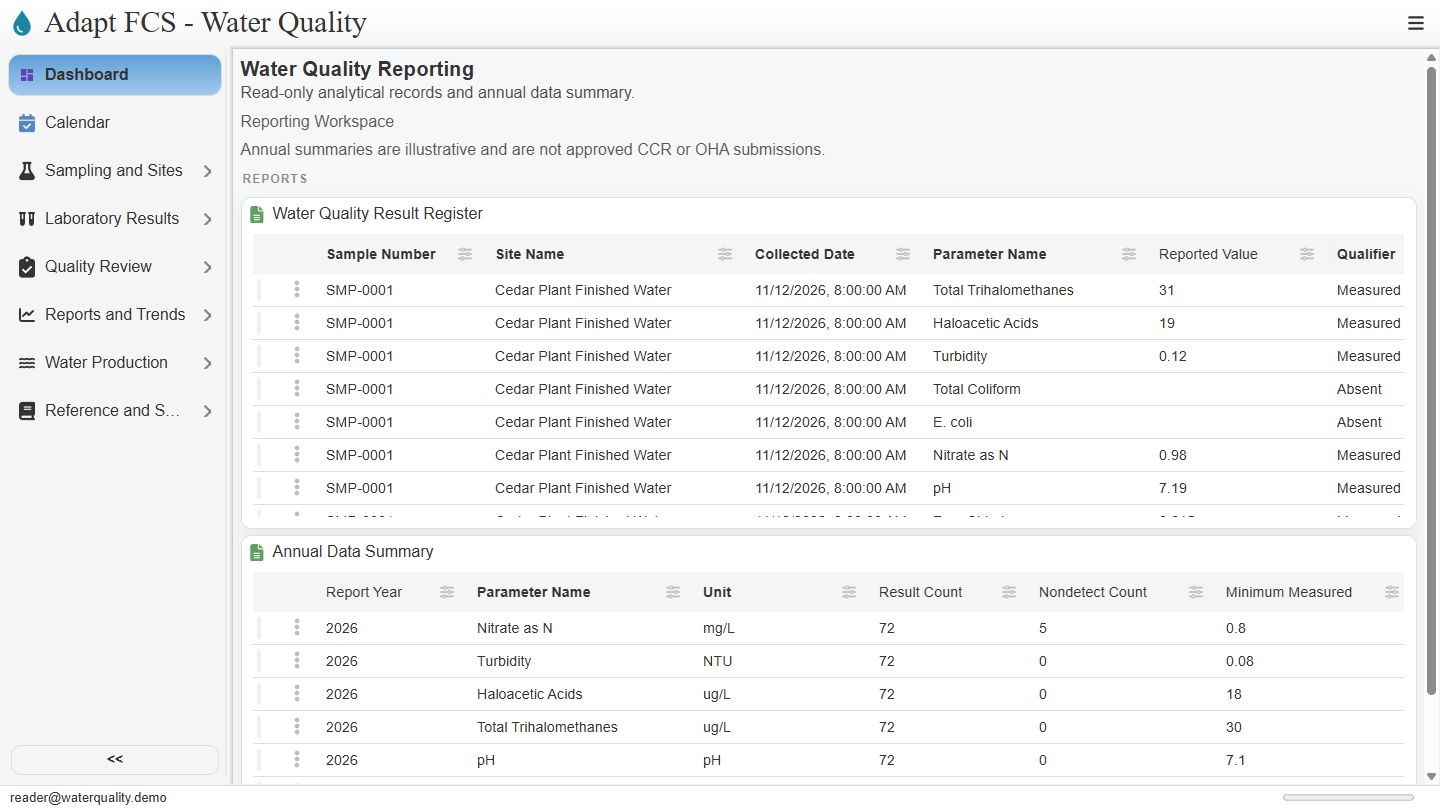
Link to chapterThe reporting account starts with the result register and annual data summary. This illustrates a reporting-focused landing page for people who mainly need information. Although the demo labels this workspace read-only, record-detail editing controls remain visible. We have not tested saving under this account, so this walkthrough does not certify effective read-only enforcement.
Design access around real responsibilities
Link to chapterFor an actual deployment, internal staff and outside contractors can be organized around their assigned responsibilities. The design can use separate sign-in choices, or a single choice with different assigned profiles. Identity-provider setup, permissions, and isolation must then be configured and verified. These screens demonstrate customizable entry and working views, with fictional individual demo accounts.
Closing
Link to chapterInstrumental closing; no narration.
No matching chapters. Try another word or clear the search to read the full script.
About this demonstration
The video uses fictional data and illustrative operating targets. It does not determine regulatory compliance or demonstrate agency submissions, live laboratory/GIS/SCADA connections, offline synchronization, or automatic sampling work generation. Staff and contractor sign-in configurations are examples; organization sign-in requires customer-specific setup and verification.
Video access is public. The interactive application has its own sign-in and permission controls. Version 1 · November 2026.