
Water Quality walkthrough
Water Production and Daily Activity
Review water sources, operating readings, a flow trend, and daily activity notes while distinguishing recorded data from live SCADA integration.
Download PDF walkthroughFull narration and screenshots, with a link back to this video.
Find what matters to you
Explore the walkthrough
Choose a chapter to play from that point, or read the full narration below.
Read the walkthrough
Narration and screenshots
The complete narration is below. Search the script or use your browser’s Find command. Select any screenshot to view it at full size.
Introduction
Link to chapterExplore how Adapt FCS organizes water-production readings and daily activity. We will review source references, inspect an operating record, switch to its flow trend, and finish with a plant-check note. The demonstration uses seeded readings and does not connect to live equipment.
Start with the configured water sources
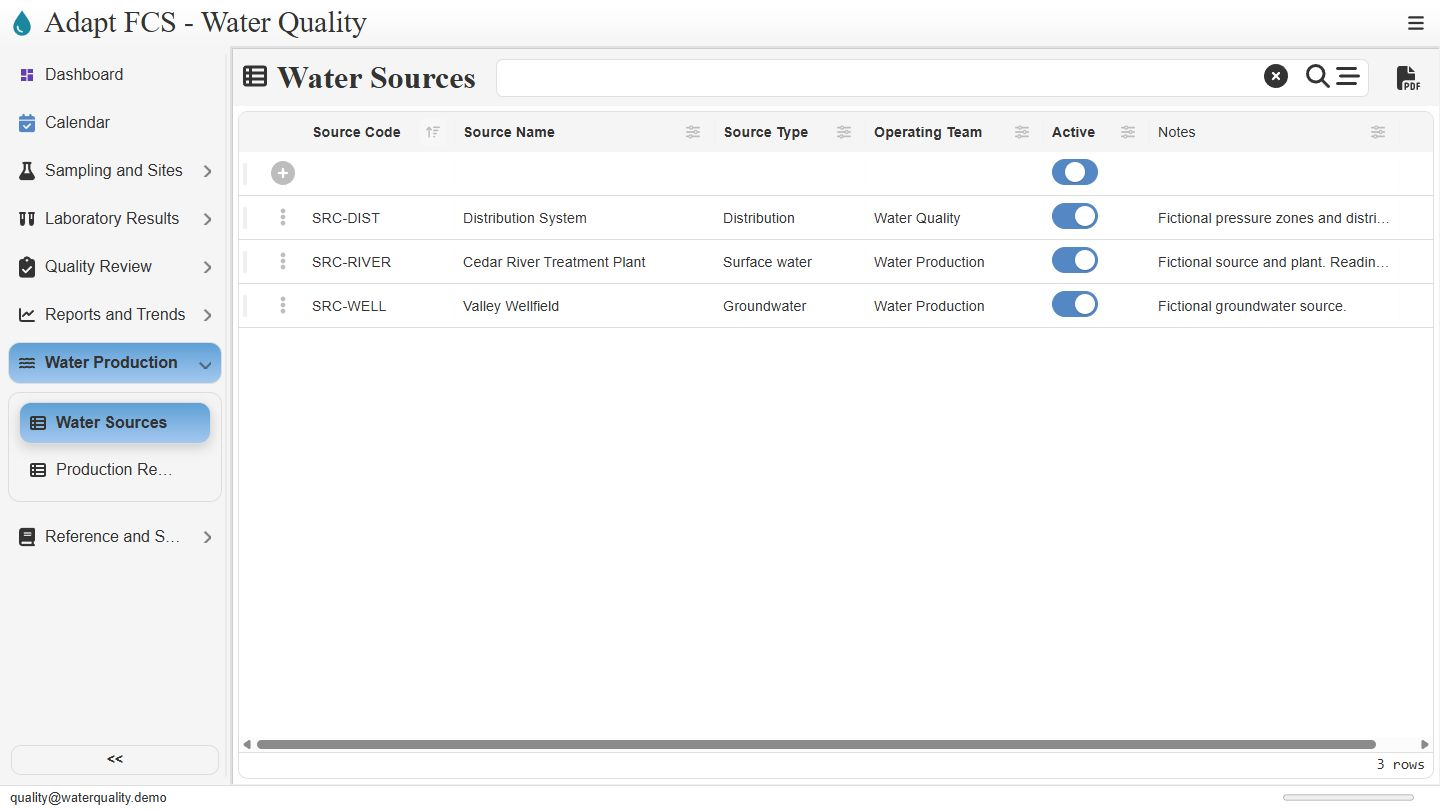
Link to chapterOpen Water Production, then Water Sources. The register identifies the distribution system, Cedar River Treatment Plant, and Valley Wellfield, along with source type, operating team, and active status. These shared references give the operating records a consistent source identity. The names and locations are fictional.
Review the operating reading series
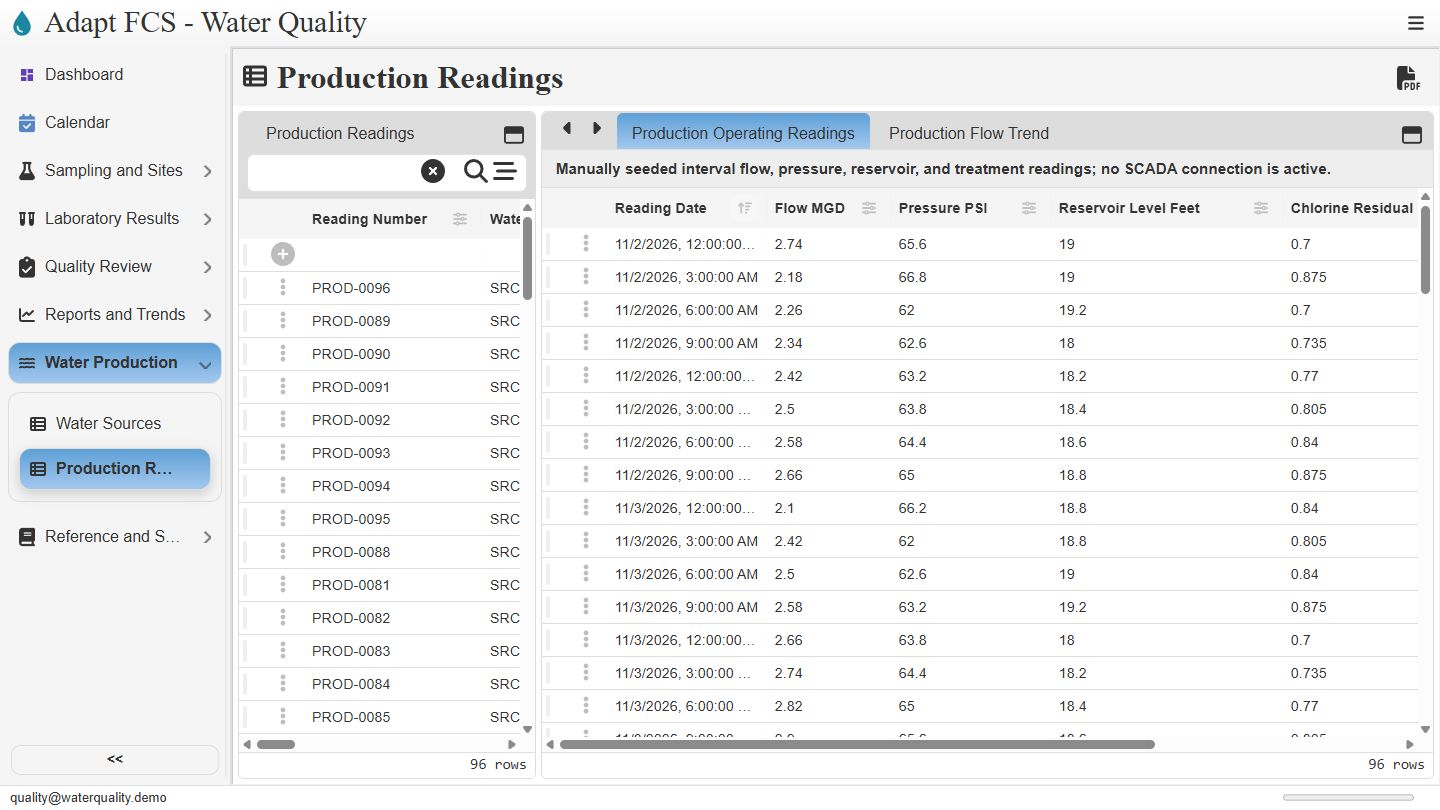
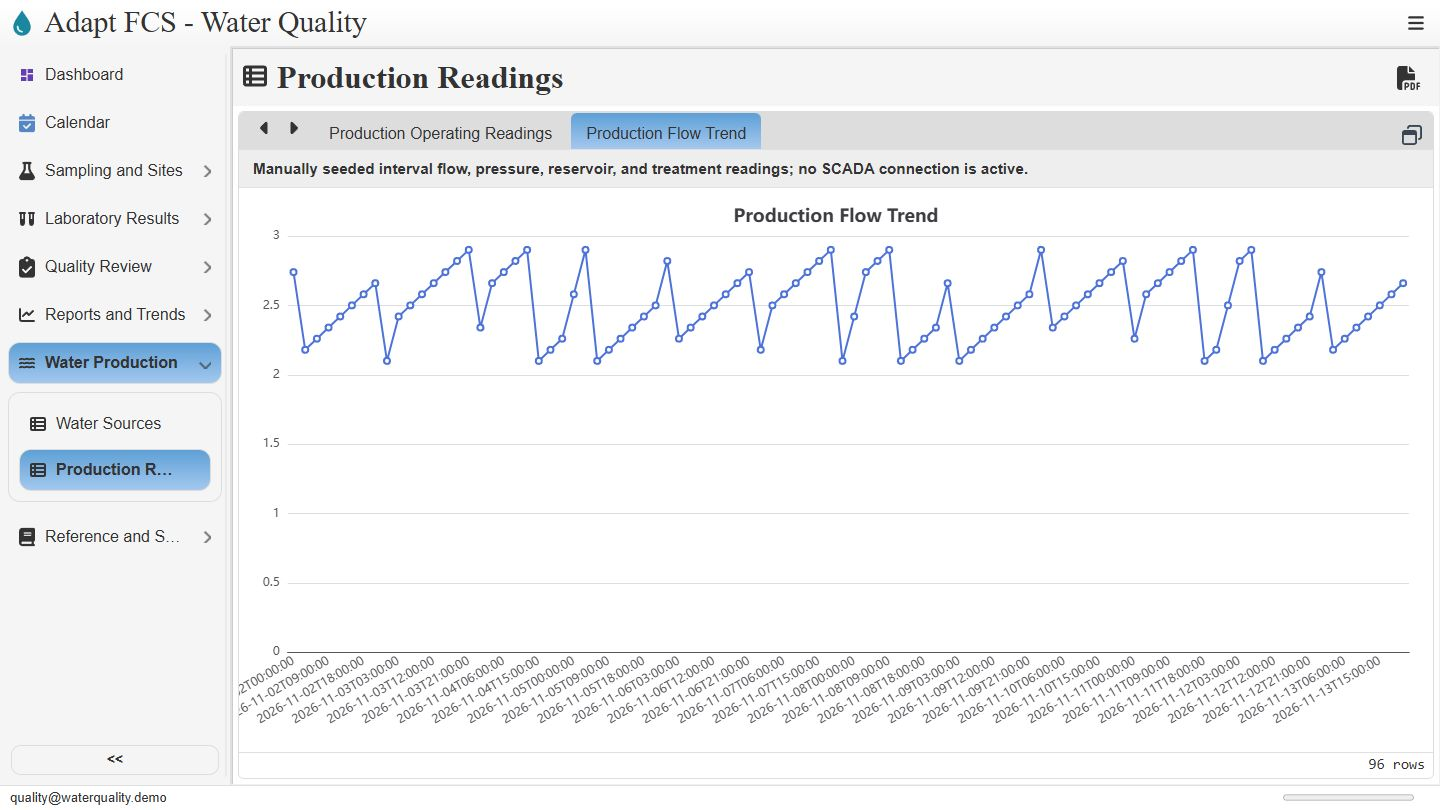
Link to chapterChoose Production Readings to see the existing interval records beside the operating report. The demonstration contains ninety-six seeded readings. Each record carries a source and time reference. Flow, pressure, reservoir level, and chlorine residual can be reviewed together rather than kept in unrelated lists.
Inspect an individual reading and its origin
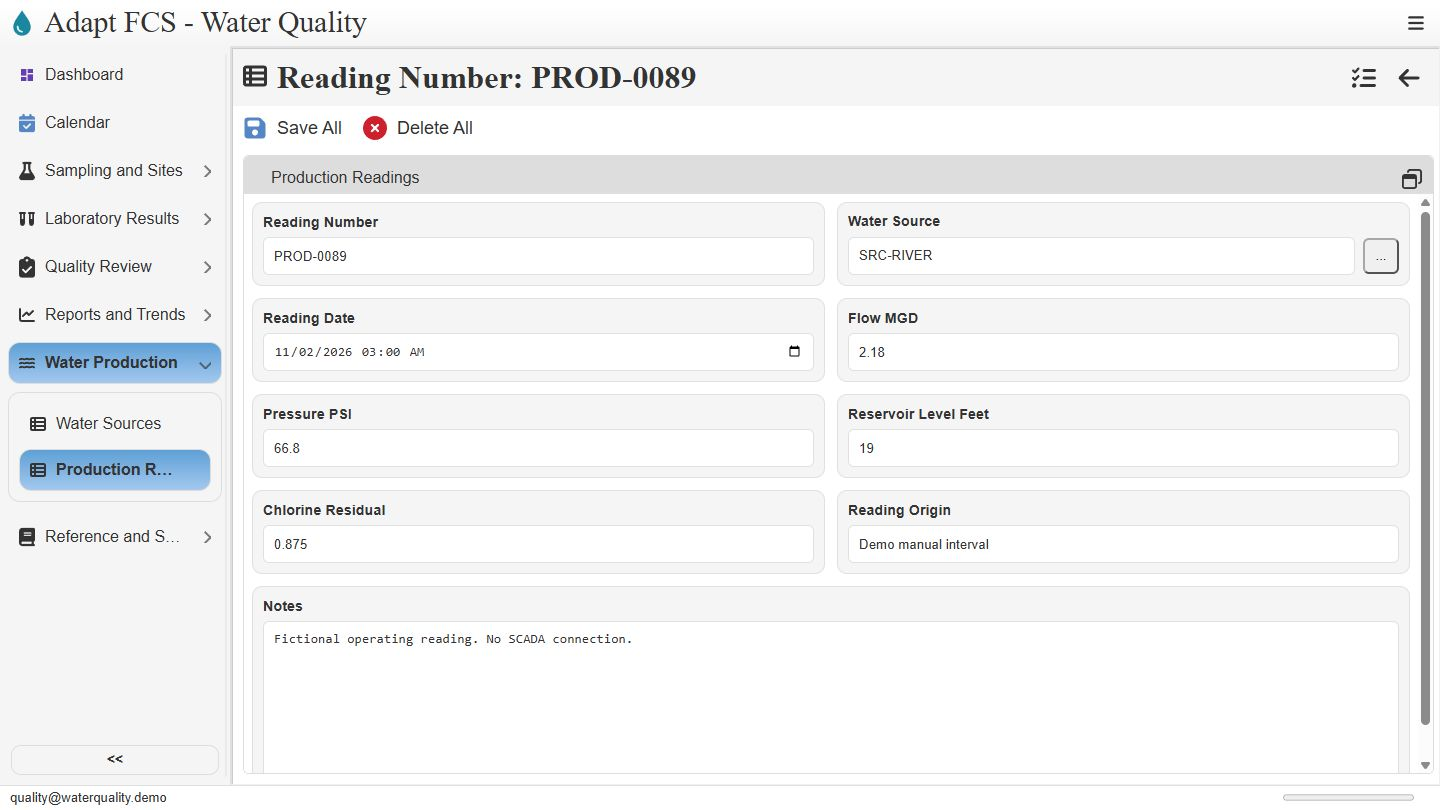
Link to chapterOpen reading zero zero eight nine. Its source is the river plant, with a recorded time, flow in million gallons per day, pressure in pounds per square inch, reservoir level in feet, and a chlorine residual entry. Reading Origin says Demo manual interval, and the note explicitly states that no SCADA connection is active.
Switch from the report to the flow chart
Link to chapterReturn to the reading view and select Production Flow Trend. Expand the pane for a clearer chart. This is another view of the recorded demonstration series. Staff should confirm the source selection, timestamps, and units when using operating trends. The chart does not imply live telemetry, forecasting, or an equipment-control connection.
Review the daily activity log
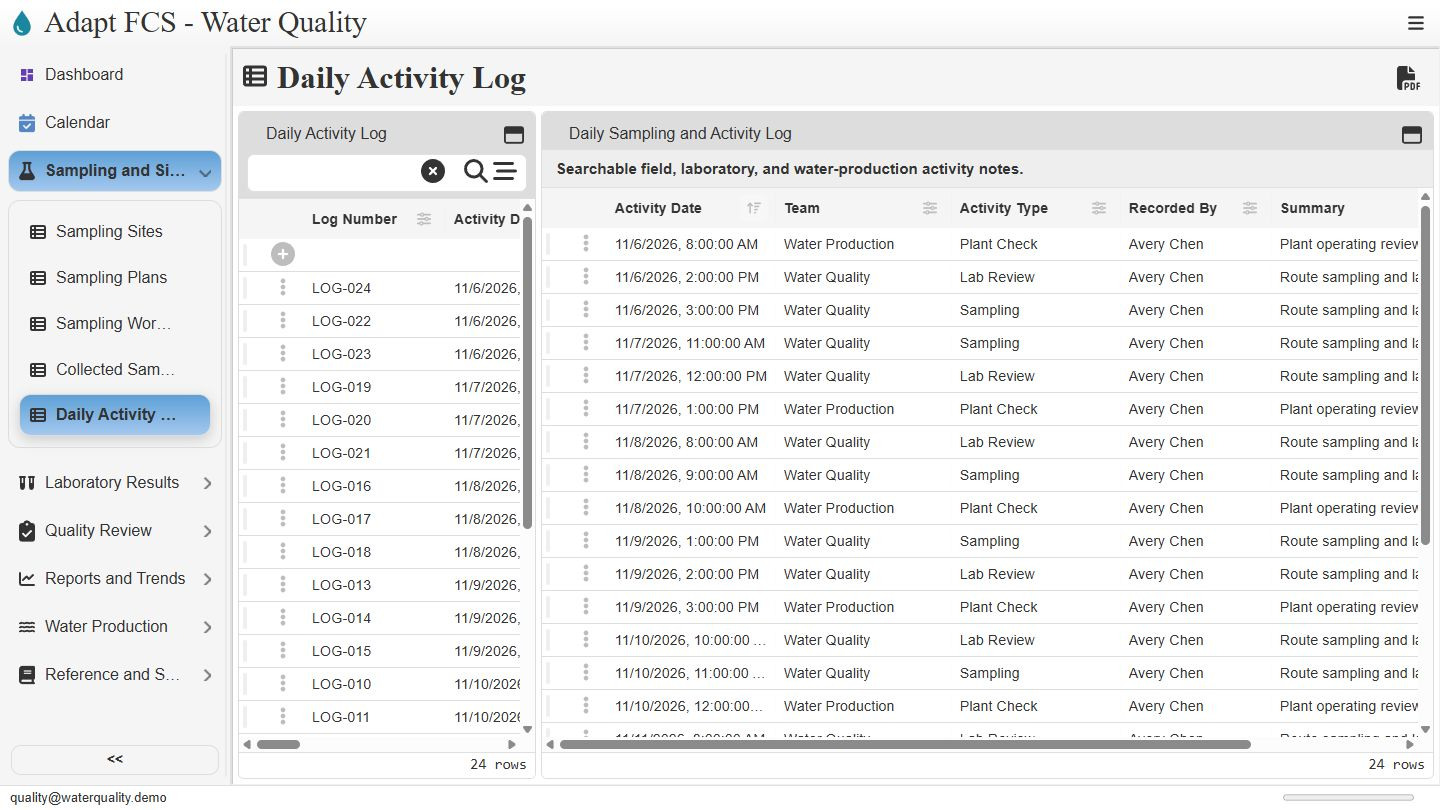
Link to chapterFor the narrative context, open Sampling and Sites and choose Daily Activity Log. The view combines sampling, laboratory review, and water-production activity notes. Dates, teams, activity types, staff names, and summaries help staff review what was recorded around the operating work. These entries are maintained by staff.
Inspect a plant-check entry
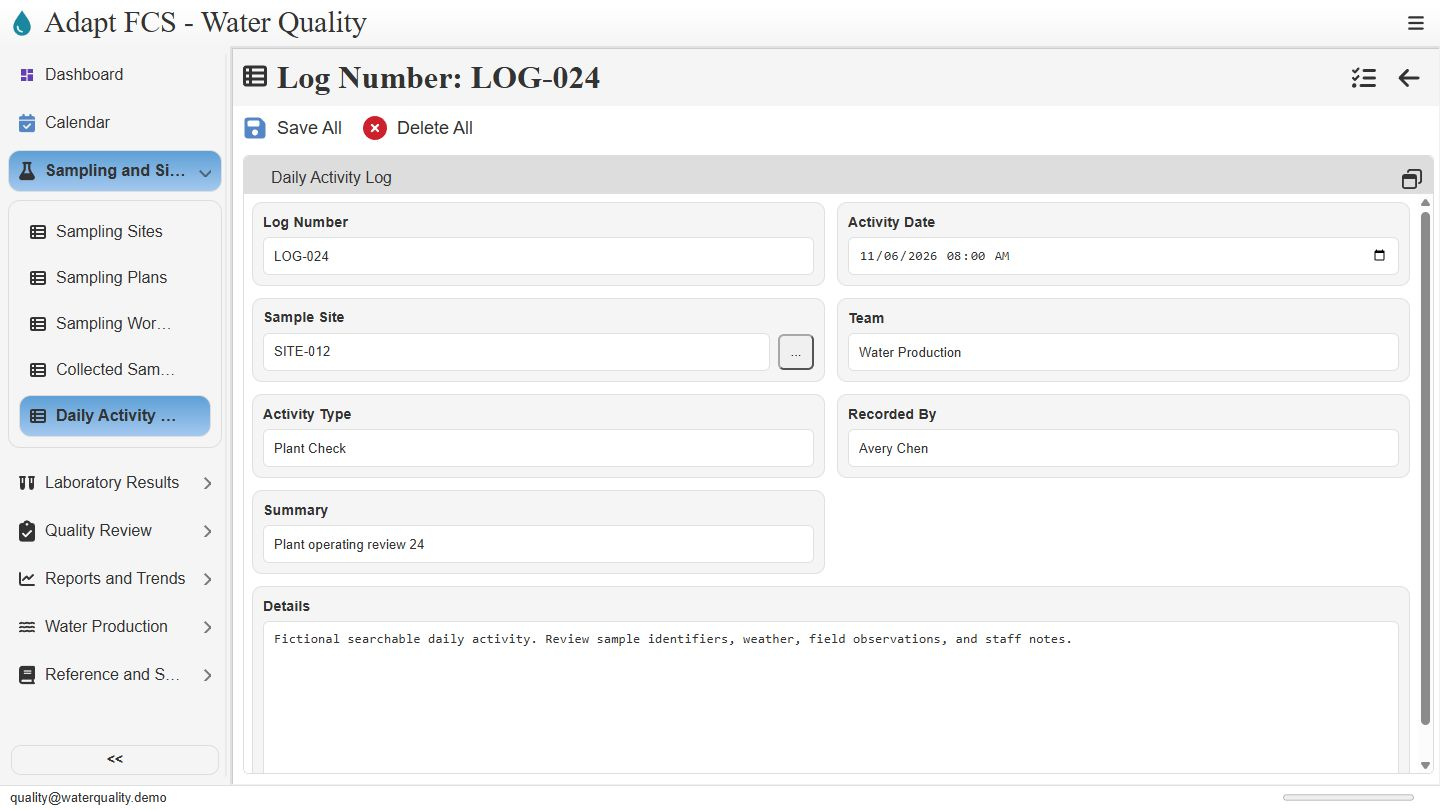
Link to chapterOpen a plant-check example. The record brings its activity date, site reference, Water Production team, recorded-by name, summary, and details together. It provides descriptive context alongside the numeric readings. We have inspected existing records without changing them. Live ingestion, automated alarms, and device integration remain outside this walkthrough.
Closing
Link to chapterInstrumental closing; no narration.
No matching chapters. Try another word or clear the search to read the full script.
About this demonstration
The video uses fictional data and illustrative operating targets. It does not determine regulatory compliance or demonstrate agency submissions, live laboratory/GIS/SCADA connections, offline synchronization, or automatic sampling work generation. Staff and contractor sign-in configurations are examples; organization sign-in requires customer-specific setup and verification.
Video access is public. The interactive application has its own sign-in and permission controls. Version 1 · November 2026.